
Biggest bite: Daily goods. Most money out: Finance.
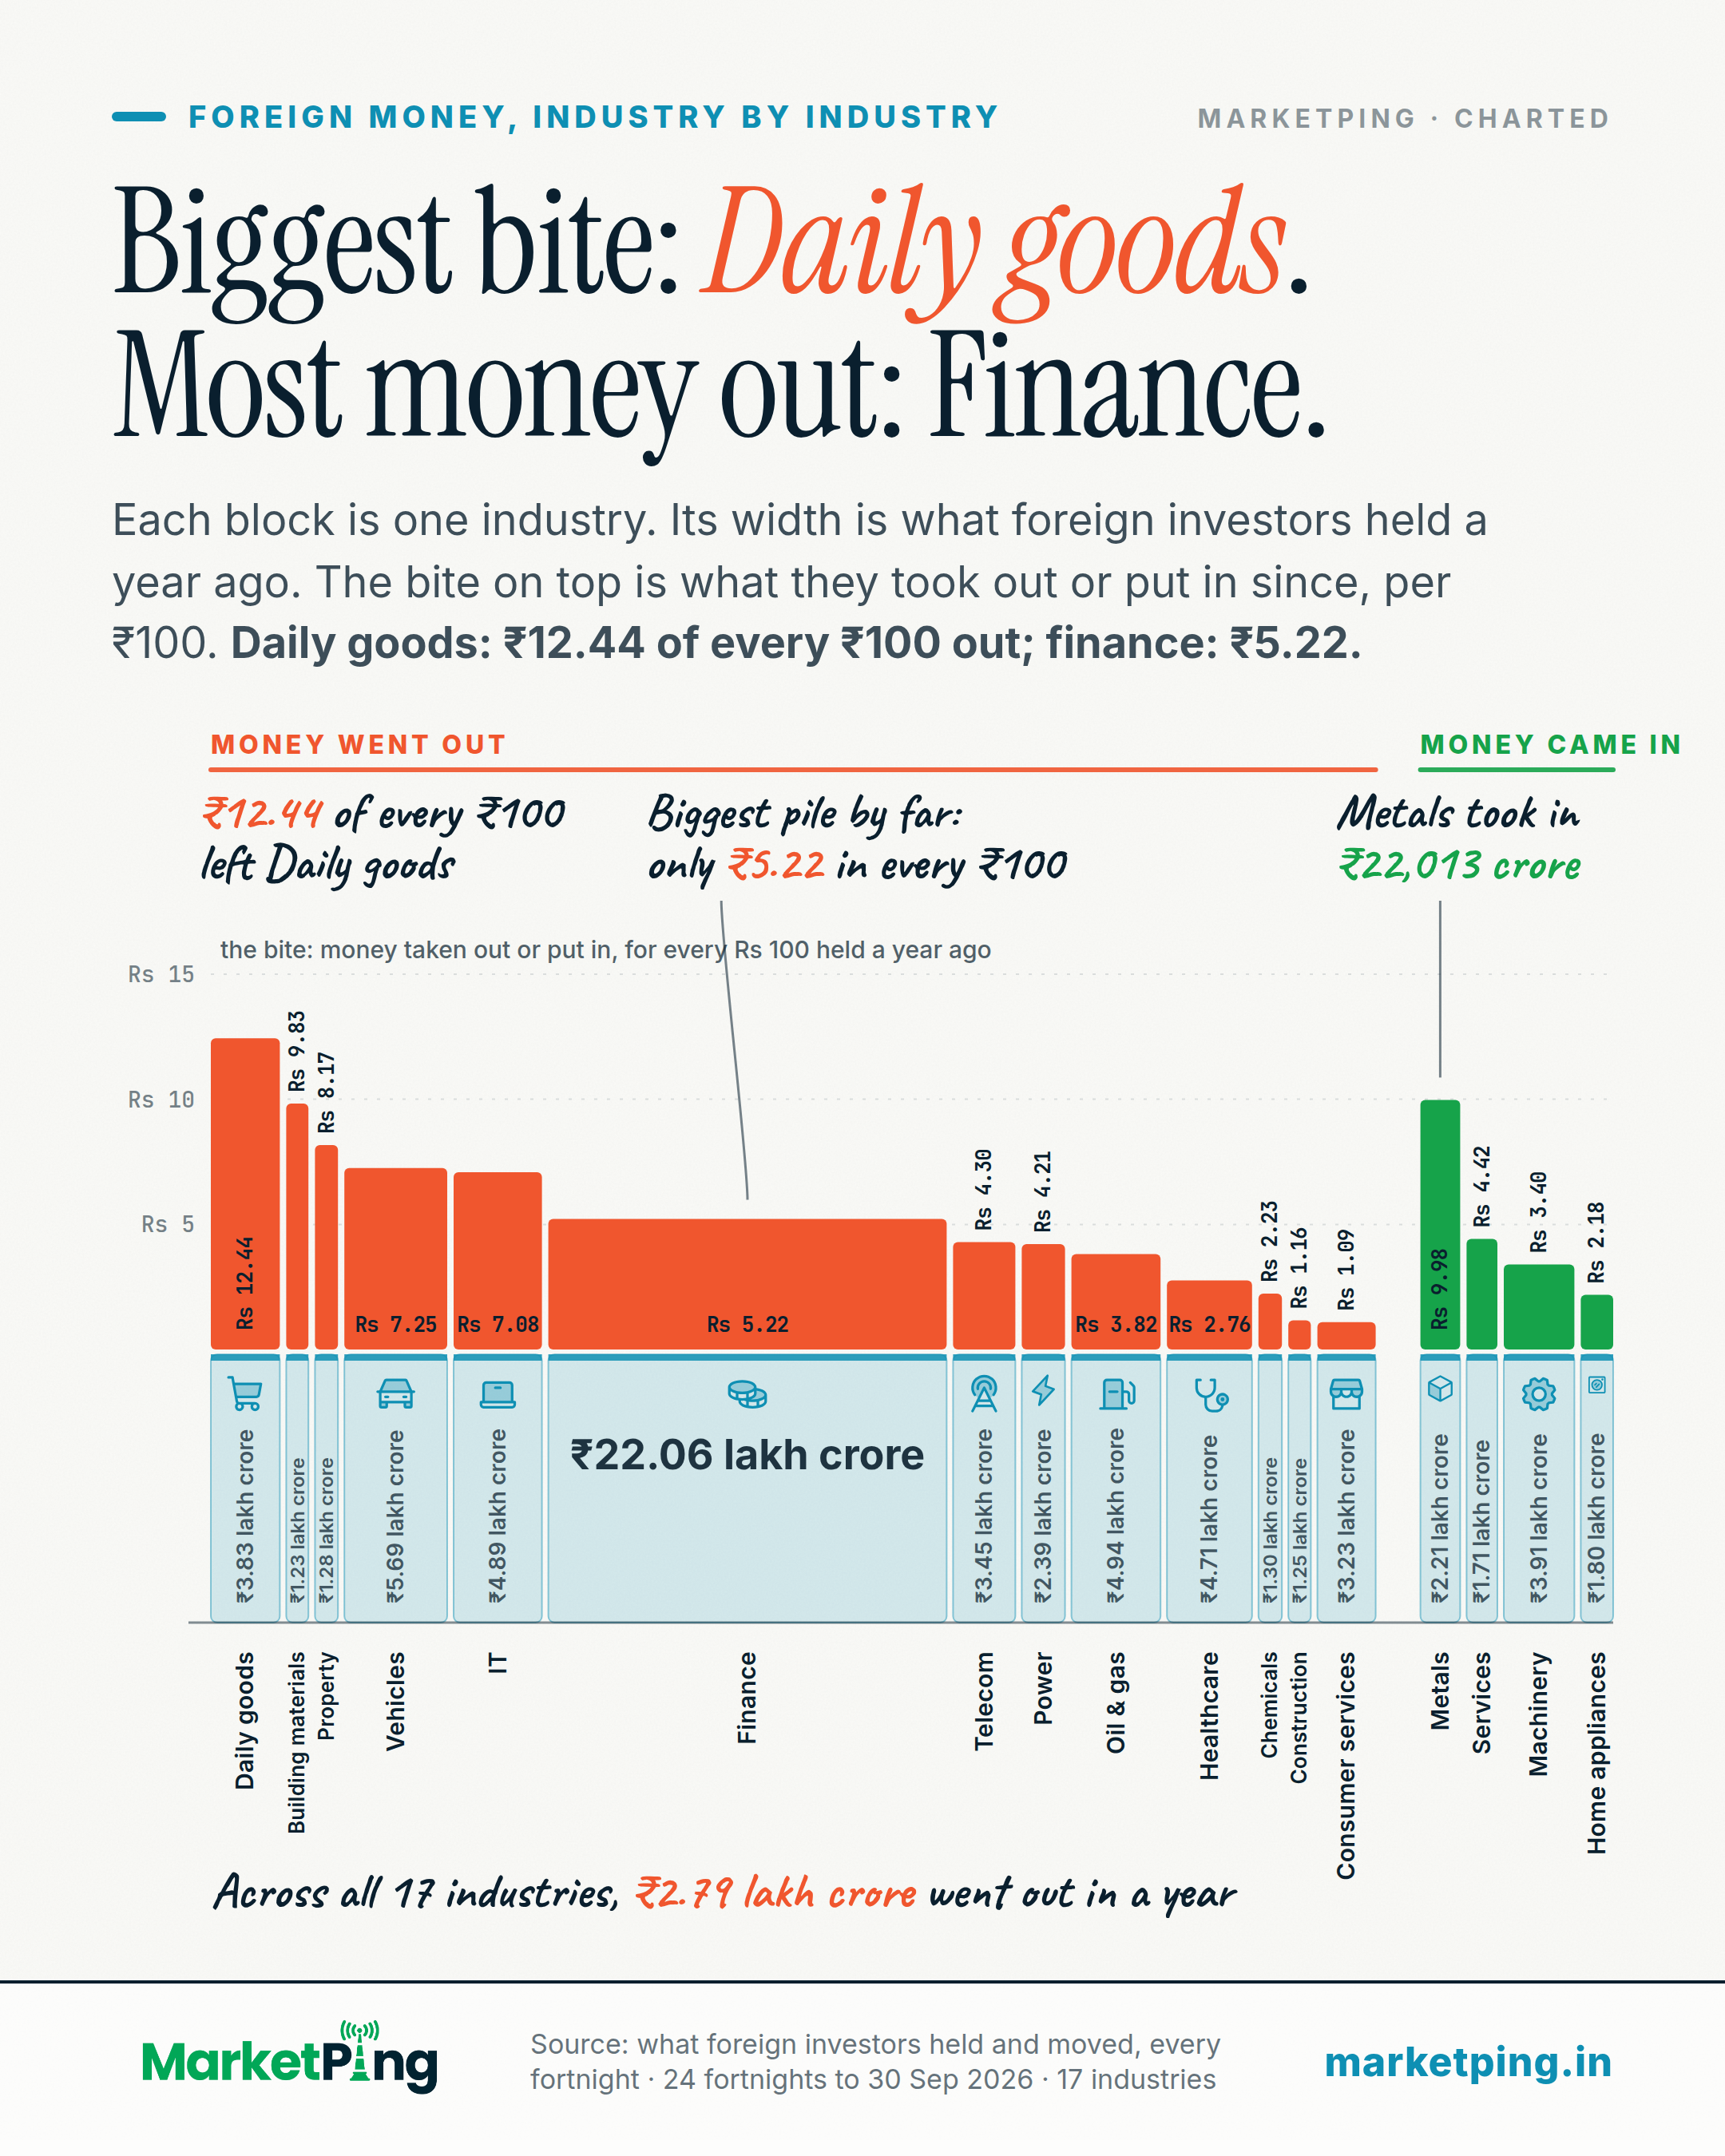
Each block is one industry. Its width is what foreign investors held a year ago. The bite on top is what they took out or put in since, per ₹100. Daily goods: ₹12.44 of every ₹100 out; finance: ₹5.22.
What the chart shows
Foreign investors took ₹2.79 lakh crore more out of Indian shares than they put in, over the twelve months to 30 Sep 2026. The rupee total and the size of the bite are two different stories: they took the most money out of finance, ₹1.15 lakh crore, but that is only ₹5.22 of every ₹100 they held there a year ago. From daily goods they took out ₹12.44 of every ₹100.
MONEY WENT OUT, biggest bite first Daily goods: ₹12.44 in every ₹100 · ₹47,582 crore out, on ₹3.83 lakh crore held a year ago Building materials: ₹9.83 in every ₹100 · ₹12,121 crore out, on ₹1.23 lakh crore held a year ago Property: ₹8.17 in every ₹100 · ₹10,437 crore out, on ₹1.28 lakh crore held a year ago Vehicles: ₹7.25 in every ₹100 · ₹41,275 crore out, on ₹5.69 lakh crore held a year ago IT: ₹7.08 in every ₹100 · ₹34,646 crore out, on ₹4.89 lakh crore held a year ago Finance: ₹5.22 in every ₹100 · ₹1.15 lakh crore out, on ₹22.06 lakh crore held a year ago Telecom: ₹4.30 in every ₹100 · ₹14,825 crore out, on ₹3.45 lakh crore held a year ago Power: ₹4.21 in every ₹100 · ₹10,077 crore out, on ₹2.39 lakh crore held a year ago Oil & gas: ₹3.82 in every ₹100 · ₹18,862 crore out, on ₹4.94 lakh crore held a year ago Healthcare: ₹2.76 in every ₹100 · ₹13,016 crore out, on ₹4.71 lakh crore held a year ago Chemicals: ₹2.23 in every ₹100 · ₹2,907 crore out, on ₹1.30 lakh crore held a year ago Construction: ₹1.16 in every ₹100 · ₹1,455 crore out, on ₹1.25 lakh crore held a year ago Consumer services: ₹1.09 in every ₹100 · ₹3,526 crore out, on ₹3.23 lakh crore held a year ago
Money came in
| Metals | ₹9.98 in every ₹100 · ₹22,013 crore in, on ₹2.21 lakh crore held a year ago |
|---|---|
| Services | ₹4.42 in every ₹100 · ₹7,534 crore in, on ₹1.71 lakh crore held a year ago |
| Machinery | ₹3.40 in every ₹100 · ₹13,271 crore in, on ₹3.91 lakh crore held a year ago |
| Home appliances | ₹2.18 in every ₹100 · ₹3,930 crore in, on ₹1.80 lakh crore held a year ago |
By rupees alone the order is different: finance ₹1.15 lakh crore, daily goods ₹47,582 crore, vehicles ₹41,275 crore.
What this is: money that foreign investors put in or took out, industry by industry, added up over 24 fortnights, against what they held when the twelve months began. What it is not: the change in the value of what they own (prices moved over the year too), and not a view on any company. 17 of the 24 groups in the data are drawn; left out: 5 with less than Rs 50,000 crore held, 1 with nothing held and nothing moved, 1 unnamed catch-all group.
How it is measured
Foreign investor money in Indian shares, by industry, added up over the 24 fortnights to 30 Sep 2026. The pile is what they held when those twelve months began; the bite is the money taken out or put in over them, shown for every Rs 100 of what they held at the start. Measuring the bite against the pile at the start rather than today's is deliberate: today's pile has already shrunk for sellers and grown for buyers, which would overstate every exit and understate every purchase.
It counts money in and money out, not the change in the value of what they own: prices moved over the year as well. 17 of the 24 groups in the data are drawn; left out: 5 with less than Rs 50,000 crore held, 1 with nothing held and nothing moved, 1 unnamed catch-all group. Industry totals cover every foreign investor together and say nothing about any one company.
How this chart has read
The finding in one sentence, on each day its numbers changed.
- Foreign investors took ₹2.79 lakh crore more out of Indian shares than they put in, over the twelve months to 30 Sep 2026. The rupee total and the size of the bite are two different stories: they took the most money out of finance, ₹1.15 lakh crore, but that is only ₹5.22 of every ₹100 they held there a year ago. From daily goods they took out ₹12.44 of every ₹100.
- Foreign investors took ₹2.72 lakh crore more out of Indian shares than they put in, over the twelve months to 15 Sep 2026. The rupee total and the size of the bite are two different stories: they took the most money out of finance, ₹1.09 lakh crore, but that is only ₹4.86 of every ₹100 they held there a year ago. From daily goods they took out ₹12.47 of every ₹100.
Using this chart
Free to quote and republish. This chart, with its text, is licensed under Creative Commons Attribution 4.0, including for commercial use and news reporting.
- Reprint the chart, or redraw it in your own style
- Quote its finding and figures
- Use it in print, online, on screen or on air
- Credit MarketPing
- Link to this page where your format allows
- Give the data date: 8 October 2026
The licence covers this page only, not the rest of MarketPing or its data. See our Terms, section 9A.
How to cite
- News storyIn print or online copy
Source: MarketPing, data as of 8 Oct 2026 (marketping.in/charts/foreign-bite) - Chart or broadcastUnder the chart, on screen or on air
Source: MarketPing (marketping.in) - Research paperAPA style
MarketPing. (2026, October 7). Biggest bite: Daily goods. Most money out: Finance. [Chart]. https://marketping.in/charts/foreign-bite
Keep the date: this chart is rebuilt every day and may read differently tomorrow.
More on the market


Facts from public exchange data and company filings. Not investment advice, and not a recommendation about any security. For frozen, citable findings with a full method, see our studies.