
Which share was traded most this year? HDFC Bank.
Each stack is roughly how many rupees of a company's shares were bought and sold. Top 10 of 3,195 shares, 1 Jan to 7 Oct.
What the chart shows
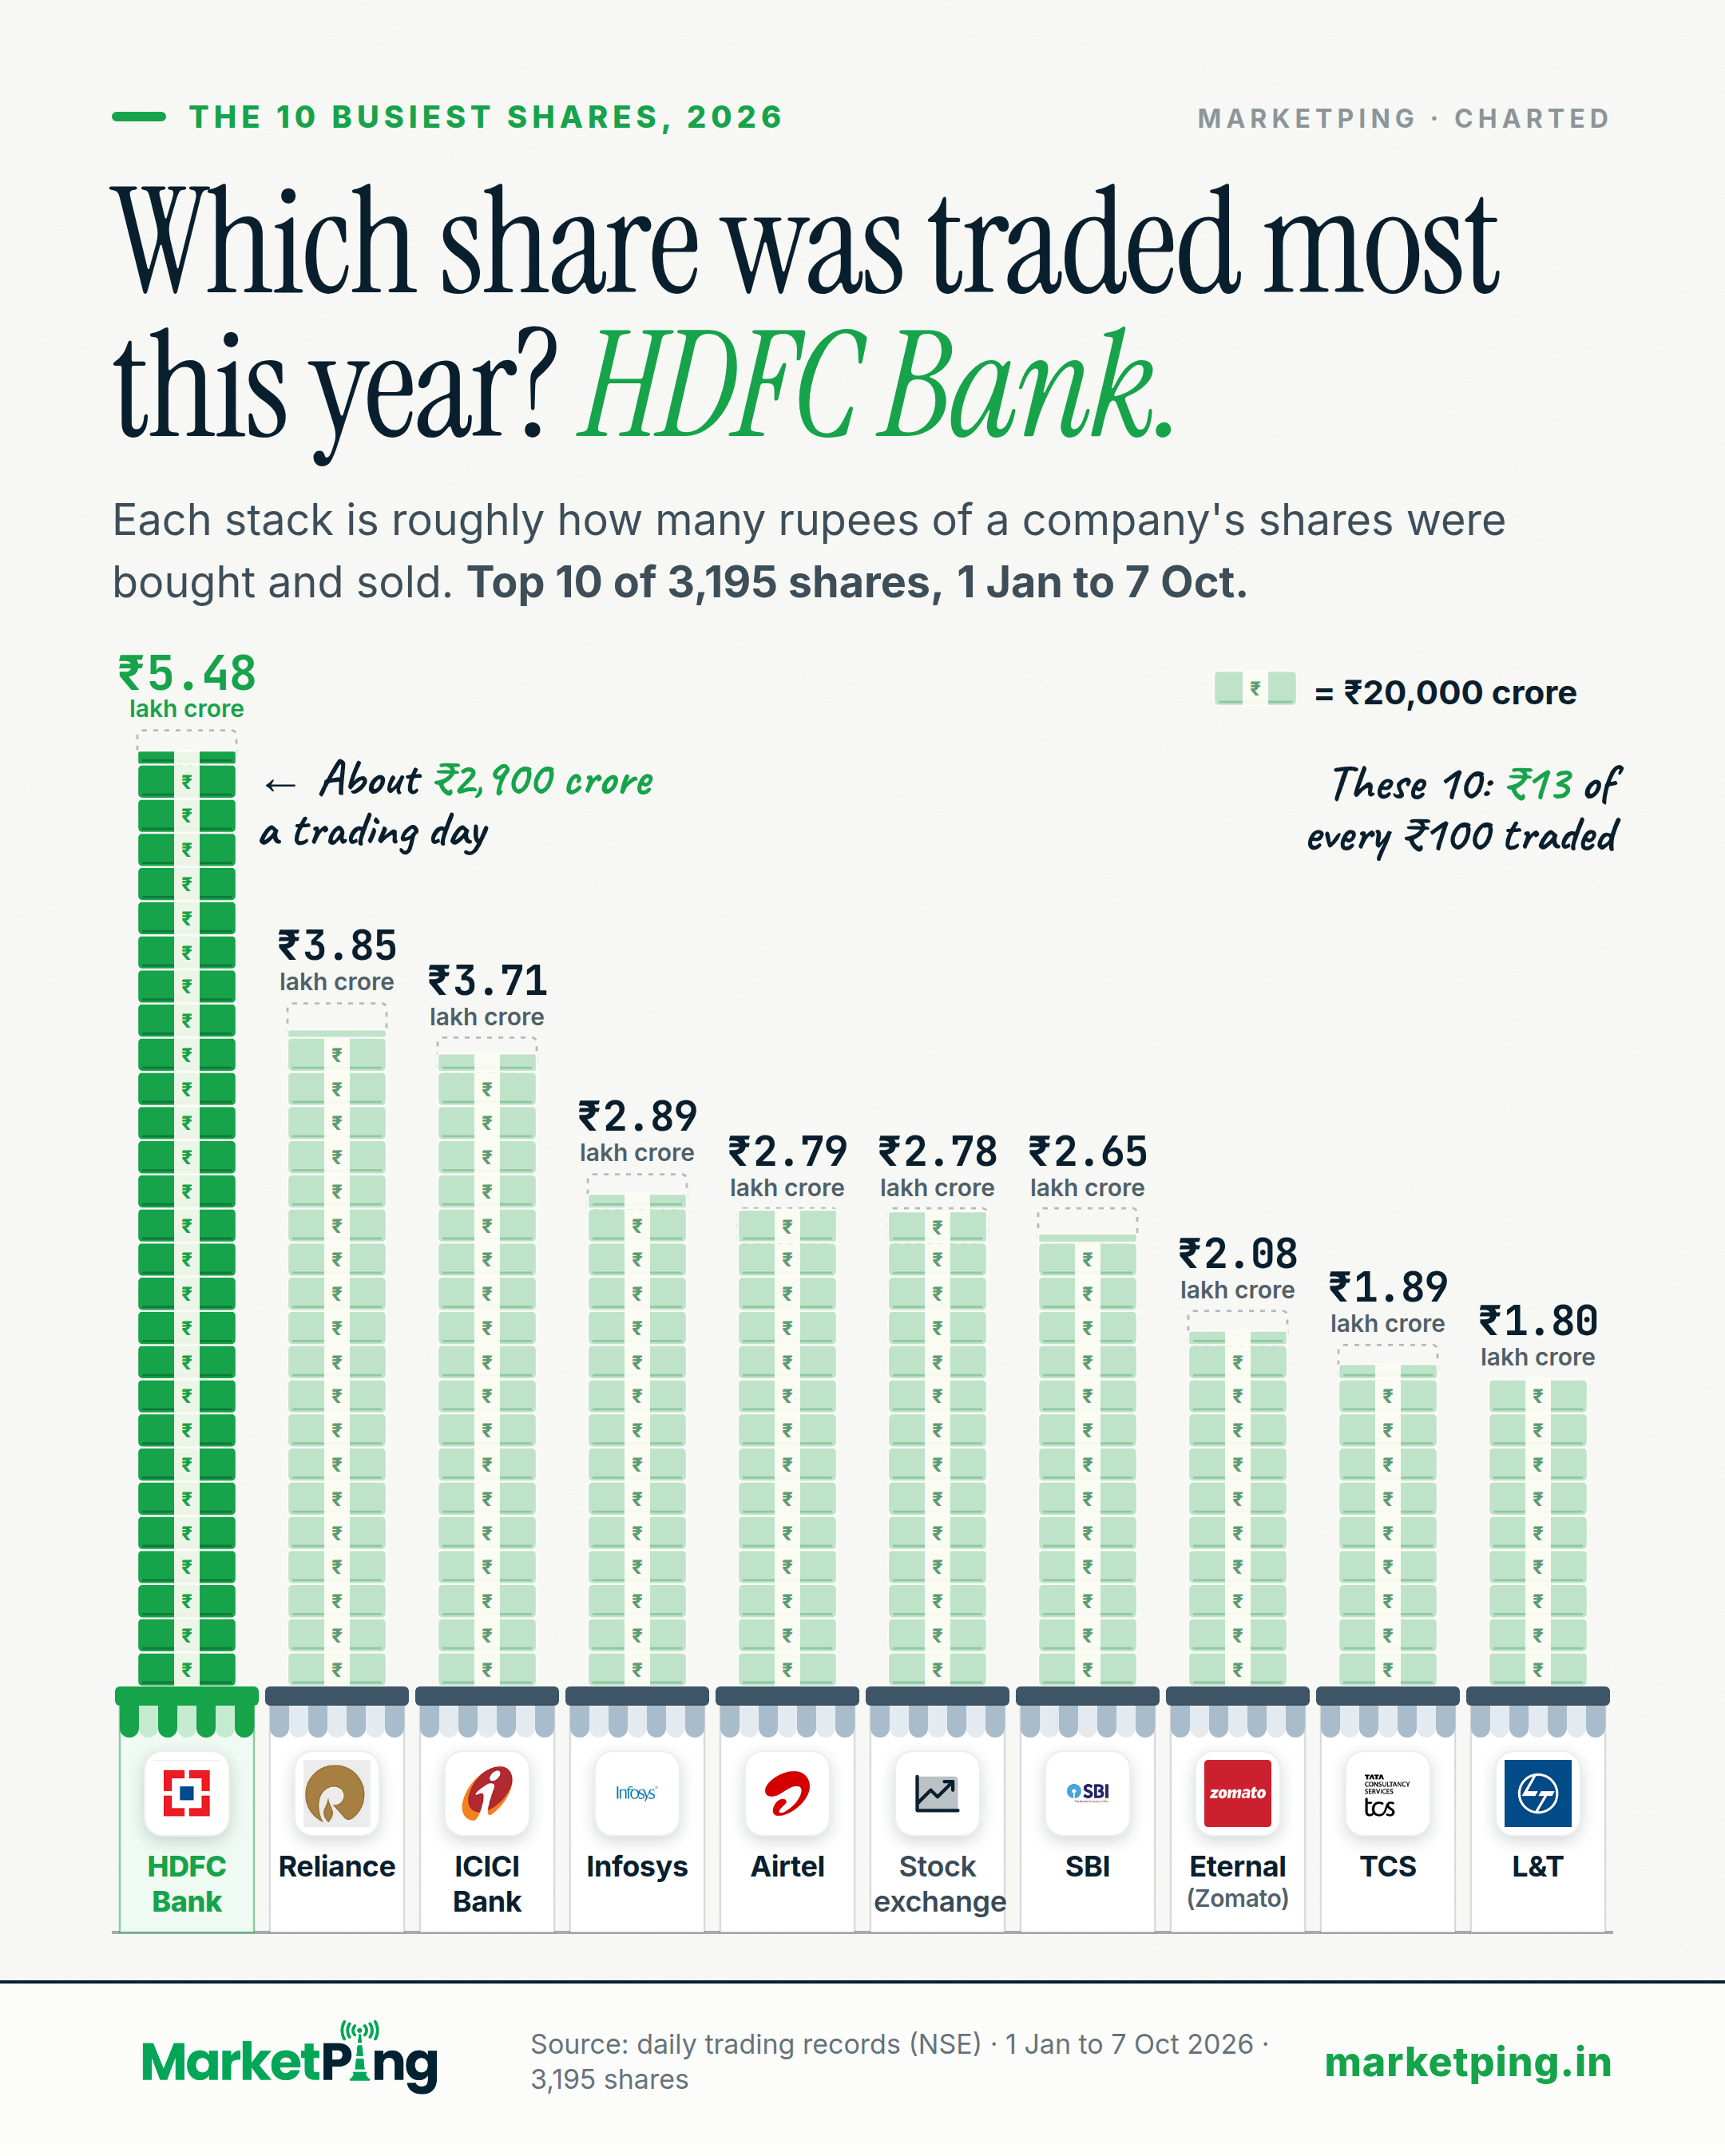
Which share was traded the most this year? HDFC Bank. About ₹5.48 lakh crore of its shares were bought and sold from 1 Jan to 7 Oct 2026, more than any of the other 3,194 shares on the market.
The 10 most traded shares (1 Jan to 7 Oct 2026, rupees' worth bought and sold, about)
| 1. HDFC Bank | ₹5.48 lakh crore |
|---|---|
| 2. Reliance | ₹3.85 lakh crore |
| 3. ICICI Bank | ₹3.71 lakh crore |
| 4. Infosys | ₹2.89 lakh crore |
| 5. Airtel | ₹2.79 lakh crore |
| 6. A stock exchange company | ₹2.78 lakh crore |
| 7. SBI | ₹2.65 lakh crore |
| 8. Eternal (Zomato) | ₹2.08 lakh crore |
| 9. TCS | ₹1.89 lakh crore |
| 10. L&T | ₹1.80 lakh crore |
These 10 together: ₹29.92 lakh crore, about ₹13 of every ₹100 of shares traded (₹222.47 lakh crore in all). HDFC Bank's average trading day: about ₹2,900 crore.
What this is: how many rupees' worth of each company's shares changed hands, a sign of how actively a share is bought and sold. Each day counts the shares traded times that day's closing price, so the figures are close, not exact. Every trade has a buyer and a seller and is counted once. What it is not: a sign that a price rose or fell, or that a share is good or bad. Not advice.
How it is measured
For every company's shares traded from 1 Jan to 7 Oct 2026 (189 trading days), we add up, day by day, the number of shares traded times that day's closing price. Shares change hands at many prices during a day, so the figure is close, not exact; using each day's average of its high, low and closing prices instead gives the same top 10 in the same order. Every trade has a buyer and a seller, and each trade is counted once.
Trades on NSE are counted; trades on BSE are not. 3,195 companies' shares were traded in these days, ₹222.47 lakh crore in all; the top 10 together were ₹29.92 lakh crore of it, about ₹13 of every ₹100. A share is counted on the days it traded, so one that started trading during the year is counted from its first day. When a company splits its shares and its share code changes, both parts of the year are added together.
Funds that trade like shares (ETFs and index funds, 358 of them, ₹10.93 lakh crore) and special share types (partly paid shares and rights, 23) are not counted. Companies that run stock exchanges or depositories are counted but not named. As checks, no share in the top 10 had a single day bigger than 20% of its year, and HDFC Bank stays first even without its busiest day (₹13,700 crore on 19 Mar).
How much of a share is bought and sold shows how busy it is. It says nothing about whether its price went up or down, or whether it is a good buy.
How this chart has read
The finding in one sentence, on each day its numbers changed.
- Which share was traded the most this year? HDFC Bank. About ₹5.48 lakh crore of its shares were bought and sold from 1 Jan to 7 Oct 2026, more than any of the other 3,194 shares on the market.
- Which share was traded the most this year? HDFC Bank. About ₹5.46 lakh crore of its shares were bought and sold from 1 Jan to 6 Oct 2026, more than any of the other 3,192 shares on the market.
- Which share was traded the most this year? HDFC Bank. About ₹5.44 lakh crore of its shares were bought and sold from 1 Jan to 5 Oct 2026, more than any of the other 3,190 shares on the market.
- Which share was traded the most this year? HDFC Bank. About ₹5.39 lakh crore of its shares were bought and sold from 1 Jan to 1 Oct 2026, more than any of the other 3,184 shares on the market.
- Which share was traded the most this year? HDFC Bank. About ₹5.37 lakh crore of its shares were bought and sold from 1 Jan to 30 Sep 2026, more than any of the other 3,182 shares on the market.
Using this chart
Free to quote and republish. This chart, with its text, is licensed under Creative Commons Attribution 4.0, including for commercial use and news reporting.
- Reprint the chart, or redraw it in your own style
- Quote its finding and figures
- Use it in print, online, on screen or on air
- Credit MarketPing
- Link to this page where your format allows
- Give the data date: 9 October 2026
The licence covers this page only, not the rest of MarketPing or its data. See our Terms, section 9A.
How to cite
- News storyIn print or online copy
Source: MarketPing, data as of 9 Oct 2026 (marketping.in/charts/most-traded) - Chart or broadcastUnder the chart, on screen or on air
Source: MarketPing (marketping.in) - Research paperAPA style
MarketPing. (2026, October 8). Which share was traded most this year? HDFC Bank. [Chart]. https://marketping.in/charts/most-traded
Keep the date: this chart is rebuilt every day and may read differently tomorrow.
More on more charts
Facts from public exchange data and company filings. Not investment advice, and not a recommendation about any security. For frozen, citable findings with a full method, see our studies.