
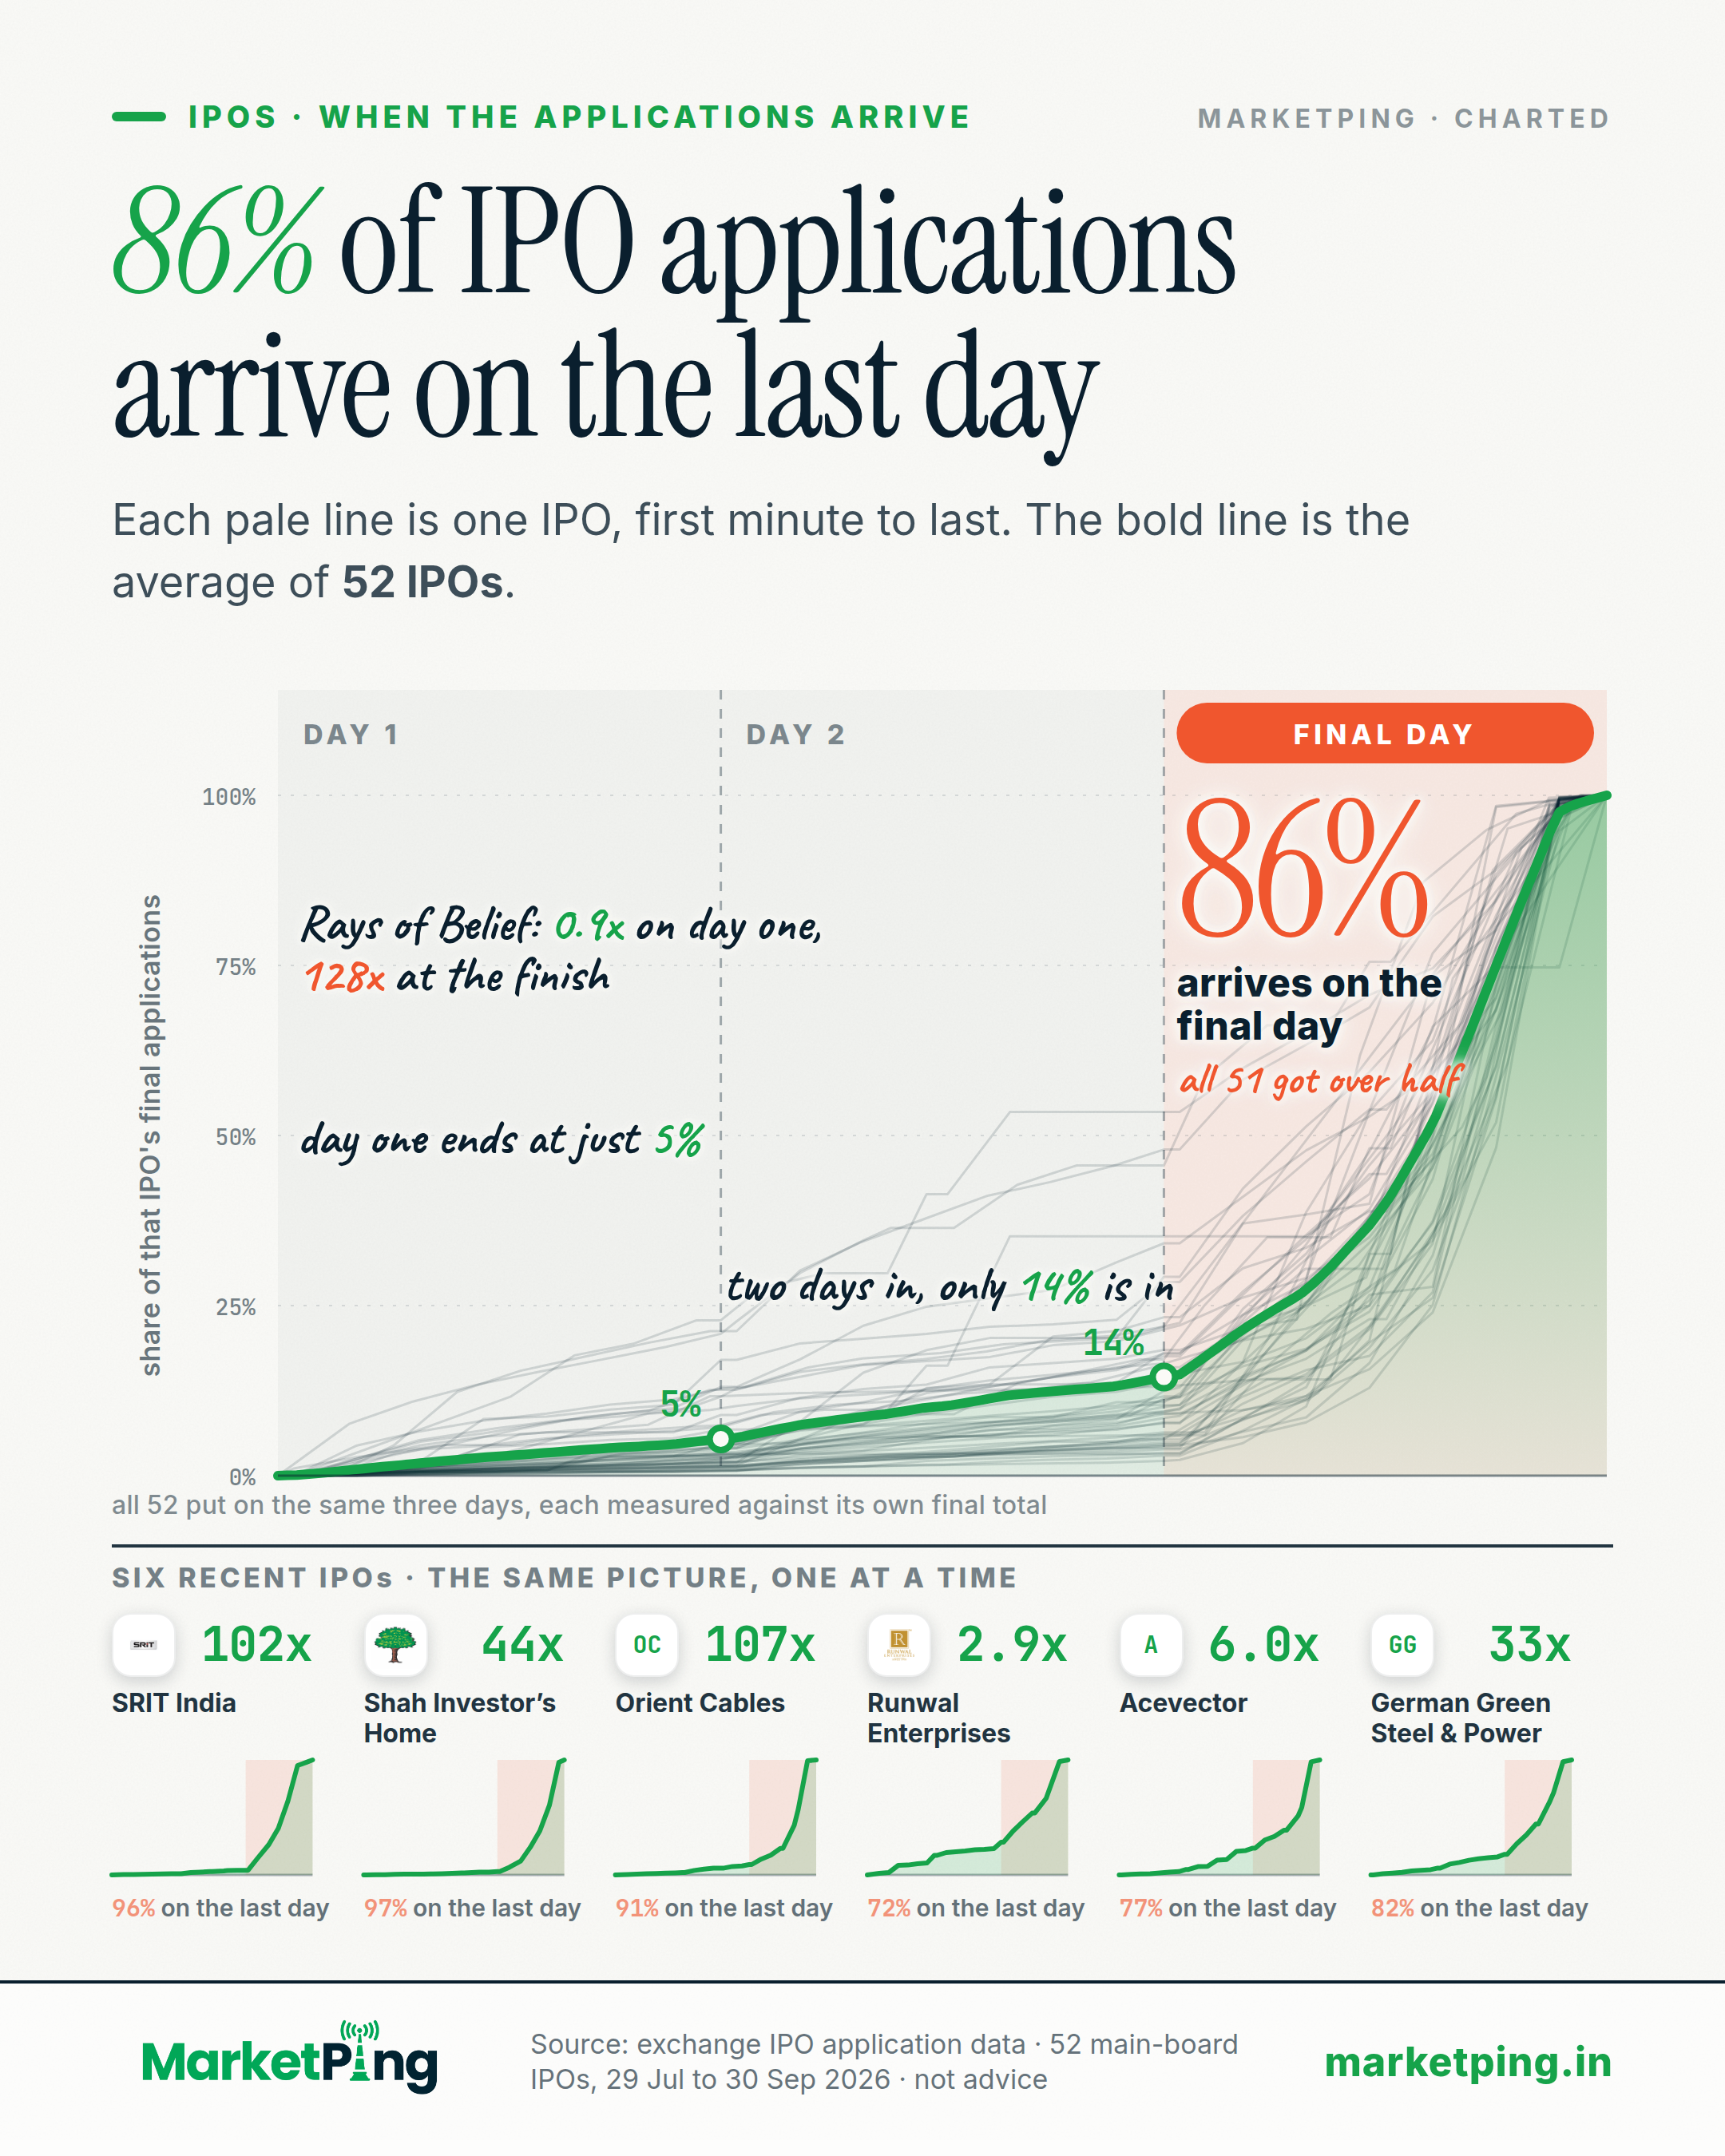
86% of IPO applications arrive on the last day
Each pale line is one IPO, first minute to last. The bold line is the average of 52 IPOs.
What the chart shows
Across 52 main-board IPOs, 86% of the applications arrived on the final day of the three days the IPO was open.
How the demand built up (average of 52 IPOs, 29 Jul to 30 Sep 2026)
- End of day one: 5% of the final applications were in.
- End of day two: 14%.
- Final day: the other 86%.
- 51 of the 52 got more than half their applications on that last day.
26 of the 52 had fewer applications than shares on offer at the end of day one. All 26 finished with more. Rays of Belief sat at 0.9x on day one and finished at 128x.
SIX RECENT IPOs (final applications, times over) 1. SRIT India: 102x, 96% of it on the last day 2. Shah Investor’s Home: 44x, 97% of it on the last day 3. Orient Cables: 107x, 91% of it on the last day 4. Runwal Enterprises: 2.9x, 72% of it on the last day 5. Acevector: 6.0x, 77% of it on the last day 6. German Green Steel & Power: 33x, 82% of it on the last day
Every IPO is put on the same two axes: time as a share of its own open hours, demand as a share of its own closing figure. Readings above the closing figure are dropped, and every figure here is read at the end of a day, where a real reading sits. This is what 52 closed IPOs did; it says nothing about the next one.
How it is measured
Source: exchange IPO application data, read every hour while each IPO was open. 52 main-board IPOs that opened and closed between 29 Jul and 30 Sep 2026, each open for three days. Every IPO is put on the same axes: time as a share of its own open hours (10 am to 5 pm on each of its three days), demand as a share of its own closing figure, so issues of different sizes and lengths can be averaged. A reading above the closing figure is a bad refresh and is dropped (8 of 1278); after that each point carries the highest reading so far.
Every figure quoted is read at the end of a day, where a real reading sits; nothing between two readings is estimated. The end of every curve is the exchange's own closing figure. Left out: 401 main-board IPOs that closed before our hourly readings begin (25 Jul), 8 that stayed open longer than three days and cannot share this axis, and all 84 small-company (SME) IPOs, which run on a separate board and are never averaged in here.
This is what 52 IPOs already closed did. It says nothing about any IPO still to come.
How this chart has read
The finding in one sentence, on each day its numbers changed.
- Across 52 main-board IPOs, 86% of the applications arrived on the final day of the three days the IPO was open.
- Across 50 main-board IPOs, 85% of the applications arrived on the final day of the three days the IPO was open.
Using this chart
Free to quote and republish. This chart, with its text, is licensed under Creative Commons Attribution 4.0, including for commercial use and news reporting.
- Reprint the chart, or redraw it in your own style
- Quote its finding and figures
- Use it in print, online, on screen or on air
- Credit MarketPing
- Link to this page where your format allows
- Give the data date: 8 October 2026
The licence covers this page only, not the rest of MarketPing or its data. See our Terms, section 9A.
How to cite
- News storyIn print or online copy
Source: MarketPing, data as of 8 Oct 2026 (marketping.in/charts/ipo-buildup) - Chart or broadcastUnder the chart, on screen or on air
Source: MarketPing (marketping.in) - Research paperAPA style
MarketPing. (2026, October 7). 86% of IPO applications arrive on the last day [Chart]. https://marketping.in/charts/ipo-buildup
Keep the date: this chart is rebuilt every day and may read differently tomorrow.
More on ipos



Facts from public exchange data and company filings. Not investment advice, and not a recommendation about any security. For frozen, citable findings with a full method, see our studies.