
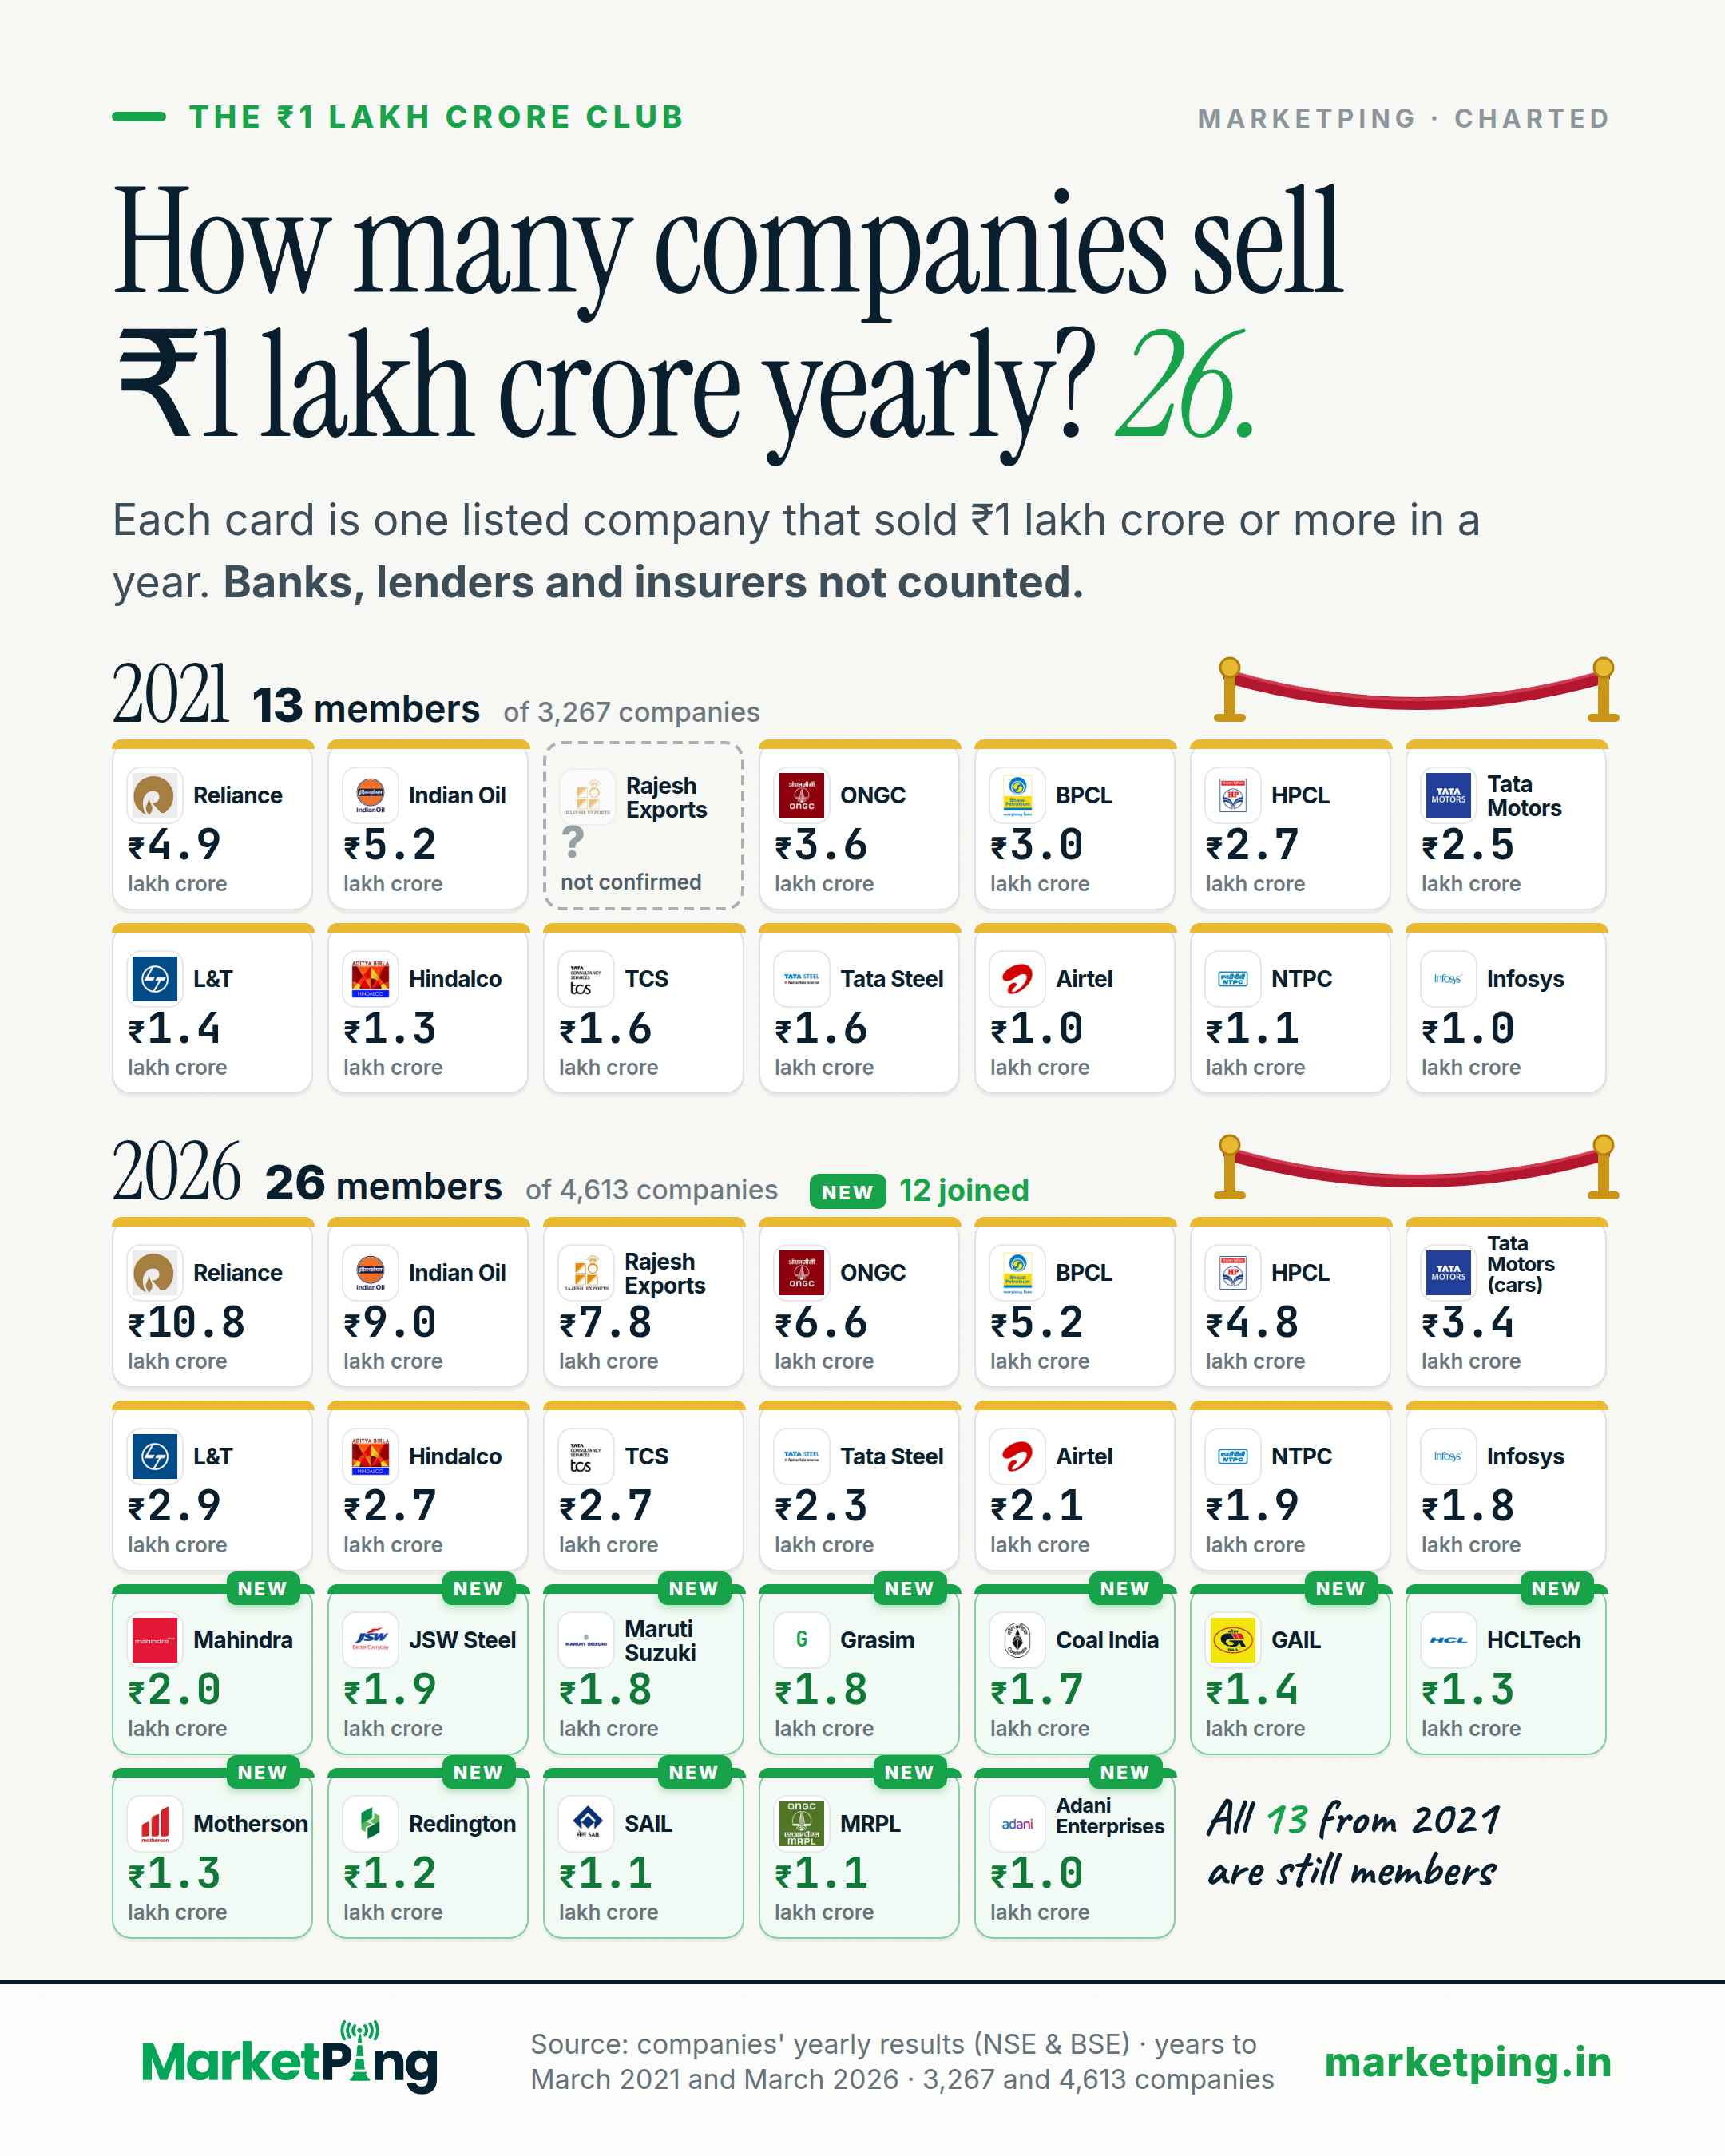
How many companies sell ₹1 lakh crore yearly? 26.
Each card is one listed company that sold ₹1 lakh crore or more in a year. Banks, lenders and insurers not counted.
What the chart shows
26 listed companies sold ₹1 lakh crore or more in the year to March 2026. Five years earlier, in the year to March 2021, 13 did (Rajesh Exports: figure for 2021 could not be confirmed).
The club in 2026 (sales in the year to March 2026)
| Reliance | ₹10,75,675 crore |
|---|---|
| Indian Oil | ₹9,01,453 crore |
| Rajesh Exports | ₹7,78,716 crore |
| ONGC | ₹6,62,247 crore |
| BPCL | ₹5,22,820 crore |
| HPCL | ₹4,78,866 crore |
| Tata Motors (cars) | ₹3,35,582 crore |
| L&T | ₹2,85,874 crore |
| Hindalco | ₹2,74,944 crore |
| TCS | ₹2,67,021 crore |
| Tata Steel | ₹2,32,140 crore |
| Airtel | ₹2,10,973 crore |
| Mahindra | ₹1,98,639 crore (new) |
| NTPC | ₹1,87,385 crore |
| JSW Steel | ₹1,85,470 crore (new) |
| Maruti Suzuki | ₹1,83,316 crore (new) |
| Infosys | ₹1,78,650 crore |
| Grasim | ₹1,75,431 crore (new) |
| Coal India | ₹1,68,400 crore (new) |
| GAIL | ₹1,42,094 crore (new) |
| HCLTech | ₹1,30,144 crore (new) |
| Motherson | ₹1,26,104 crore (new) |
| Redington | ₹1,19,162 crore (new) |
| SAIL | ₹1,10,811 crore (new) |
| MRPL | ₹1,05,155 crore (new) |
| Adani Enterprises | ₹1,00,469 crore (new) |
The club in 2021 (year to March 2021)
| Indian Oil | ₹5,20,237 crore |
|---|---|
| Reliance | ₹4,86,326 crore |
| ONGC | ₹3,60,572 crore |
| BPCL | ₹3,04,266 crore |
| HPCL | ₹2,70,578 crore |
| Tata Motors | ₹2,49,795 crore |
| TCS | ₹1,64,177 crore |
| Tata Steel | ₹1,56,294 crore |
| L&T | ₹1,35,979 crore |
| Hindalco | ₹1,31,985 crore |
| NTPC | ₹1,11,531 crore |
| Airtel | ₹1,00,616 crore |
| Infosys | ₹1,00,472 crore |
All 13 members from 2021 are still in the club, and 12 joined.
What this is: each company's yearly sales from its own accounts, for the whole group. Banks, lenders and insurers are left out. What it is not: profit, or a judgement on any company. Sales grow with prices as well as with the amount sold.
How it is measured
Sales here are a company's revenue from operations for the year: the money it earned from selling its goods and services, from its own yearly accounts. For a company that owns others, it is the whole group's figure (consolidated), which includes every company it owns more than half of; a company without group accounts is counted on its own. The club is every listed company with sales of ₹1 lakh crore or more in the year to March 2026 (26 companies), and the same for the year to March 2021 (13).
Banks, lenders and insurers are left out, because what they earn is interest and insurance money, not sales. In all, 4,613 listed companies (outside banks, lenders and insurers) filed yearly sales for 2026, and 3,267 for 2021. As a check against reading errors, a figure counts only when it agrees with the company's sales the year before (between half and double), its four quarters add up to it within 10%, and it fits the company's size (no more than ten times what it owns).
A figure that fails a check still counts when the company states it in its own words in a document we hold for that year (Rajesh Exports and Coal India for 2026; Hindalco for 2021). Rajesh Exports' figure for 2021 could not be confirmed (it fails the checks and we hold no document for that year), so it is not counted for 2021, shown there as "not confirmed", and not marked new. 8 other companies whose 2021 figures in our data show ₹1 lakh crore or more are left out, because those figures fail the checks; each of them reports sales of under ₹10,000 crore for 2026. Vedanta is under the line: its own accounts give ₹78,437 crore for 2026, because they leave out the businesses it plans to split off into separate companies.
Tata Motors split in two in 2025: the company that sells cars and Jaguar Land Rover kept the listing (shown for 2026 as Tata Motors (cars)), and its truck business is now listed separately. The members' sales are not added up: some members own others, so a total would count the same sales twice. Sales are not profit, and they grow with prices as well as with the amount sold.
This says nothing about whether any company is good, cheap or well run.
Using this chart
Free to quote and republish. This chart, with its text, is licensed under Creative Commons Attribution 4.0, including for commercial use and news reporting.
- Reprint the chart, or redraw it in your own style
- Quote its finding and figures
- Use it in print, online, on screen or on air
- Credit MarketPing
- Link to this page where your format allows
- Give the data date: 8 October 2026
The licence covers this page only, not the rest of MarketPing or its data. See our Terms, section 9A.
How to cite
- News storyIn print or online copy
Source: MarketPing, data as of 8 Oct 2026 (marketping.in/charts/lakh-club) - Chart or broadcastUnder the chart, on screen or on air
Source: MarketPing (marketping.in) - Research paperAPA style
MarketPing. (2026, October 7). How many companies sell ₹1 lakh crore yearly? 26. [Chart]. https://marketping.in/charts/lakh-club
Keep the date: this chart is rebuilt every day and may read differently tomorrow.
More on more charts



Facts from public exchange data and company filings. Not investment advice, and not a recommendation about any security. For frozen, citable findings with a full method, see our studies.