
Who waits longest to get paid? Construction: 106 days.
Each square is one day customers took to pay, on average. Year to March 2026, 2,339 companies in 12 industries.
What the chart shows
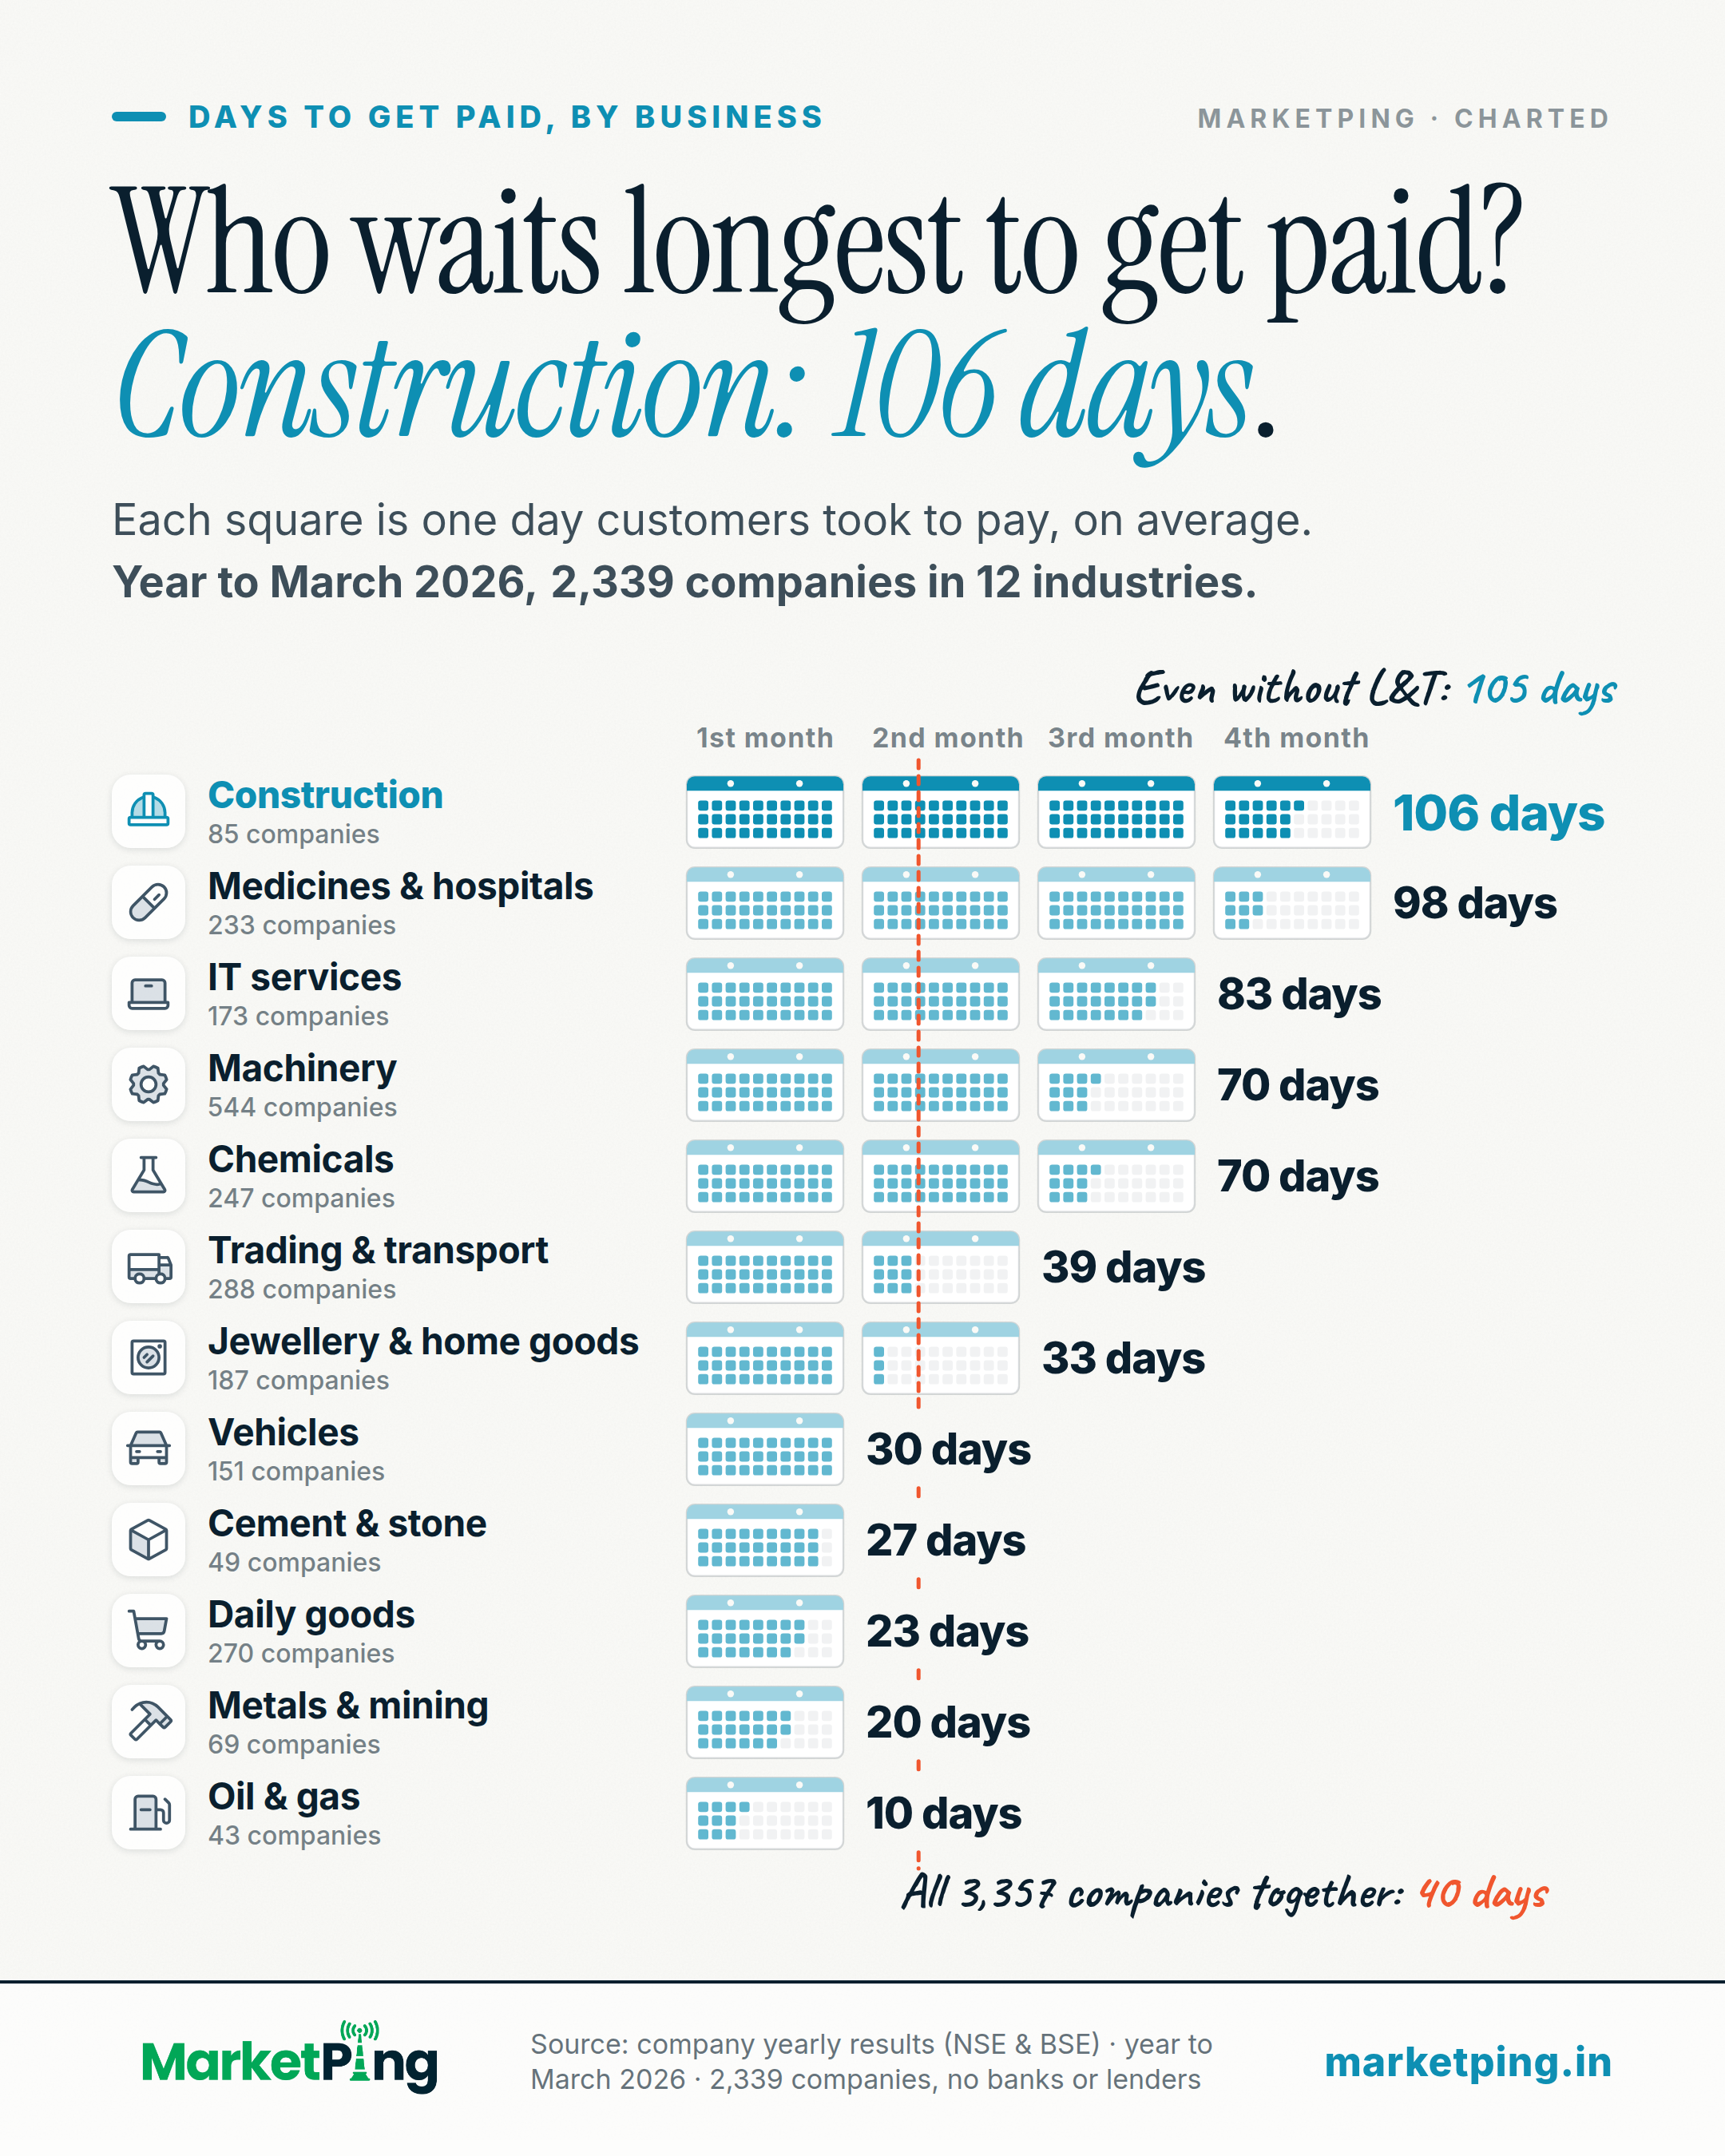
In the year to March 2026, construction companies waited the longest to get paid by their customers: 106 days on average, about 3½ months. Oil and gas companies waited the least, 10 days. All 3,357 companies together: 40 days.
Days to get paid, by industry
| Construction | 106 days (85 companies) |
|---|---|
| Medicines & hospitals | 98 days (233 companies) |
| IT services | 83 days (173 companies) |
| Machinery | 70 days (544 companies) |
| Chemicals | 70 days (247 companies) |
| Trading & transport | 39 days (288 companies) |
| Jewellery & home goods | 33 days (187 companies) |
| Vehicles | 30 days (151 companies) |
| Cement & stone | 27 days (49 companies) |
| Daily goods | 23 days (270 companies) |
| Metals & mining | 20 days (69 companies) |
| Oil & gas | 10 days (43 companies) |
Smaller industries, not drawn: Media 79 days (71 companies), Clothes & textiles 59 days (234 companies), Property 56 days (121 companies), Paper 36 days (44 companies), Shops & hotels 25 days (145 companies). Left out: power (45 companies; NTPC alone is 41% of its sales), mixed businesses (12 companies) and telecom (27 companies): too few companies, or one company too big to add up fairly. Is it just one big company? No: leave out L&T and construction companies still waited 105 days.
How it is worked out: the money customers still owed at the year end, divided by the year's sales, times 365 days. All the companies in an industry are added together, so big companies weigh more. Only companies that reported both figures above zero are counted. Each company's own accounts are used, so money owed to it by its own group companies counts too. Banks and lenders are left out. What it is not: one company's figure, or any one bill. It is not late payment or default: it includes the normal time companies give their customers to pay. And it is not a reason to buy a share.
How it is measured
Days to get paid, industry by industry, for the year to March 2026, from each company's own yearly accounts: the company alone, not its group (standalone), so a listed company owned by another listed company is not counted twice. For each industry: the money its customers still owed at the year end (trade receivables due within a year, from the balance sheet), all its companies added together, divided by all their sales for the year added together, times 365 days. So it is an average wait, set from one year-end snapshot against a whole year of sales; big companies weigh more than small ones.
It includes the normal credit time a company gives its customers, so it is not late payment or default. In a company's own accounts, money owed to it by its own group companies counts as owed by customers. Only companies with both figures above zero are counted (3,357): left out are 720 banks, lenders, insurers and other financial companies, 293 with no sales, 824 that did not report money owed by customers and 136 that reported zero (a zero here can mean "not reported", so it is not read as "paid at once"), and 1 with a figure below zero. 200 small companies were owed more than a whole year of sales; they are kept (all companies together: 40 days without them).
Industry is the industry group on file for each company, in plain words; Construction is building contractors (roads, bridges, plants); Cement & stone is cement, granite, marble, glass and roofing makers; Power includes water and waste companies; Jewellery & home goods is jewellery, paint, appliances and other things for the home. 319 of the 3,357 companies have no industry on file and are in no row (together 70 days); they are in the all-company 40 days. An industry is drawn only with at least 40 companies and no one company above 40% of its sales, else the row would be one company's result. Left out on that rule: Power (45 companies; NTPC is 41% of its sales), Mixed businesses (12 companies), Telecom (27 companies).
The chart shows the top industry and then the biggest industries by sales, 12 in all (88% of all the sales); the smaller ones are in the post text. The top industry is named in the headline only because it stays above every other industry even with each industry's biggest company left out (Construction without L&T: 105 days). A calendar page holds 30 days; the days are rounded to whole days.
This is arithmetic on filed accounts, not a view on any company or industry.
Using this chart
Free to quote and republish. This chart, with its text, is licensed under Creative Commons Attribution 4.0, including for commercial use and news reporting.
- Reprint the chart, or redraw it in your own style
- Quote its finding and figures
- Use it in print, online, on screen or on air
- Credit MarketPing
- Link to this page where your format allows
- Give the data date: 8 October 2026
The licence covers this page only, not the rest of MarketPing or its data. See our Terms, section 9A.
How to cite
- News storyIn print or online copy
Source: MarketPing, data as of 8 Oct 2026 (marketping.in/charts/pay-wait) - Chart or broadcastUnder the chart, on screen or on air
Source: MarketPing (marketping.in) - Research paperAPA style
MarketPing. (2026, October 7). Who waits longest to get paid? Construction: 106 days. [Chart]. https://marketping.in/charts/pay-wait
Keep the date: this chart is rebuilt every day and may read differently tomorrow.
More on more charts



Facts from public exchange data and company filings. Not investment advice, and not a recommendation about any security. For frozen, citable findings with a full method, see our studies.