
Companies have twice as many shareholders as in 2019
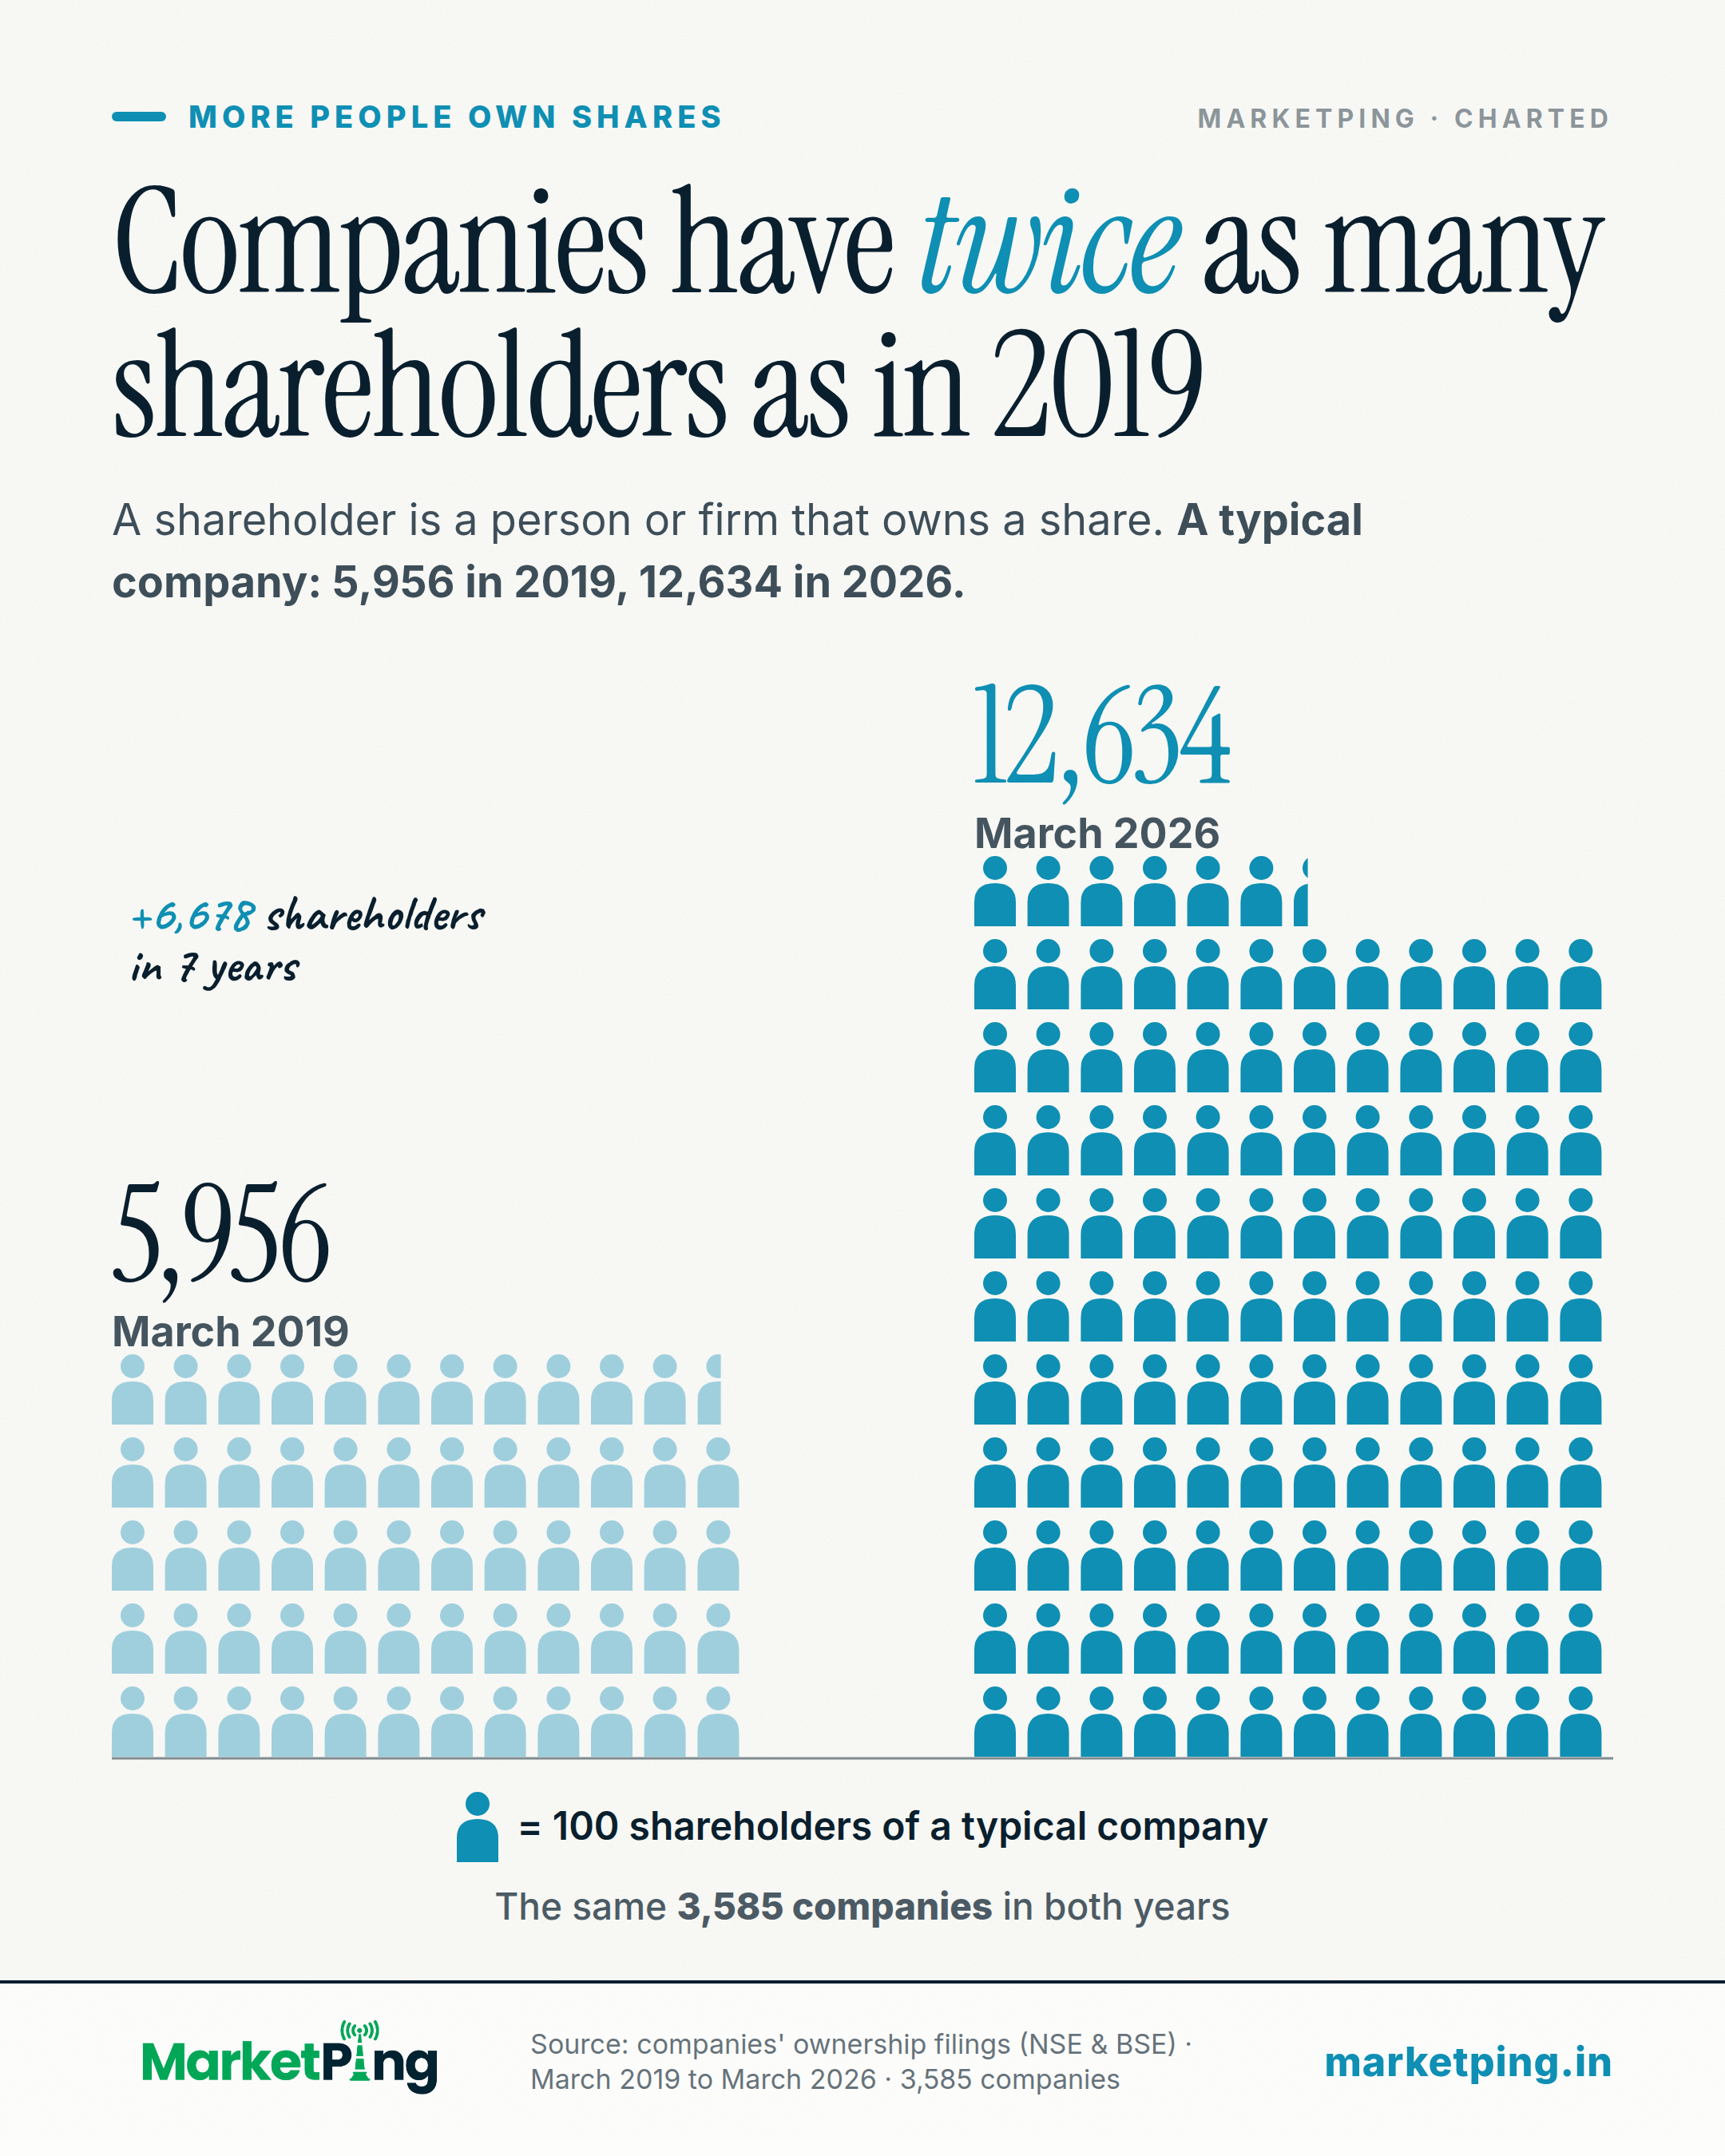
A shareholder is a person or firm that owns a share. A typical company: 5,956 in 2019, 12,634 in 2026.
What the chart shows
In March 2026, the typical listed company had 12,634 shareholders, 2.1 times the 5,956 it had in March 2019. Same 3,585 companies in both counts.
Shareholders of the typical company, each march (the same 3,585 companies)
| March 2019 | 5,956 |
|---|---|
| March 2020 | 5,927 |
| March 2021 | 6,307 |
| March 2022 | 8,427 |
| March 2023 | 9,174 |
| March 2024 | 10,649 |
| March 2025 | 12,546 |
| March 2026 | 12,634 |
The biggest one-year rise was 2021 to 2022: +2,120. The last year, 2025 to 2026, added 88. 3,037 of the 3,585 companies had more shareholders in March 2026 than in March 2019; 1,608 at least doubled.
A shareholder is any person or firm that owns at least one share. The typical company is the middle one: half have more shareholders, half have fewer. Only companies with a count in every March are included, so the rise is not just more companies being counted. Counts cannot be added across companies: someone who owns shares in ten companies is counted ten times. The count says how many people and firms own a company, not how big, good or cheap it is.
How it is measured
Shareholders are the people and firms that held at least one share of a company on 31 March, as each company reports it in its quarterly ownership filing (shareholding pattern). Only companies with a count for every March from 2019 to 2026 are included: 3,585 companies. More companies file every year (3,647 in March 2019, 4,581 in March 2026), so keeping the same companies is what makes the rise real and not just more companies being counted.
Each company is counted once a year, from its newest filing for that quarter. The typical company is the middle one: half the companies have more shareholders, half have fewer. A person who owns shares in two companies is counted in both, so these counts cannot be added up to a number of people. 6 companies with a count that jumps or drops more than tenfold for a single year and then returns (a likely filing error) were checked: without them the rise is 2.13 times instead of 2.12.
The number of shareholders says how many people and firms own a company. It says nothing about how big, good or cheap the company is.
Using this chart
Free to quote and republish. This chart, with its text, is licensed under Creative Commons Attribution 4.0, including for commercial use and news reporting.
- Reprint the chart, or redraw it in your own style
- Quote its finding and figures
- Use it in print, online, on screen or on air
- Credit MarketPing
- Link to this page where your format allows
- Give the data date: 7 October 2026
The licence covers this page only, not the rest of MarketPing or its data. See our Terms, section 9A.
How to cite
- News storyIn print or online copy
Source: MarketPing, data as of 7 Oct 2026 (marketping.in/charts/shareholder-boom) - Chart or broadcastUnder the chart, on screen or on air
Source: MarketPing (marketping.in) - Research paperAPA style
MarketPing. (2026, October 6). Companies have twice as many shareholders as in 2019 [Chart]. https://marketping.in/charts/shareholder-boom
Keep the date: this chart is rebuilt every day and may read differently tomorrow.
More on owners and boards
Facts from public exchange data and company filings. Not investment advice, and not a recommendation about any security. For frozen, citable findings with a full method, see our studies.