
Where does company cash go? ₹44 into new plants.
Each piece is where part of the ₹100 went: the wider, the more. 4,481 companies added together, year to March 2026.
What the chart shows
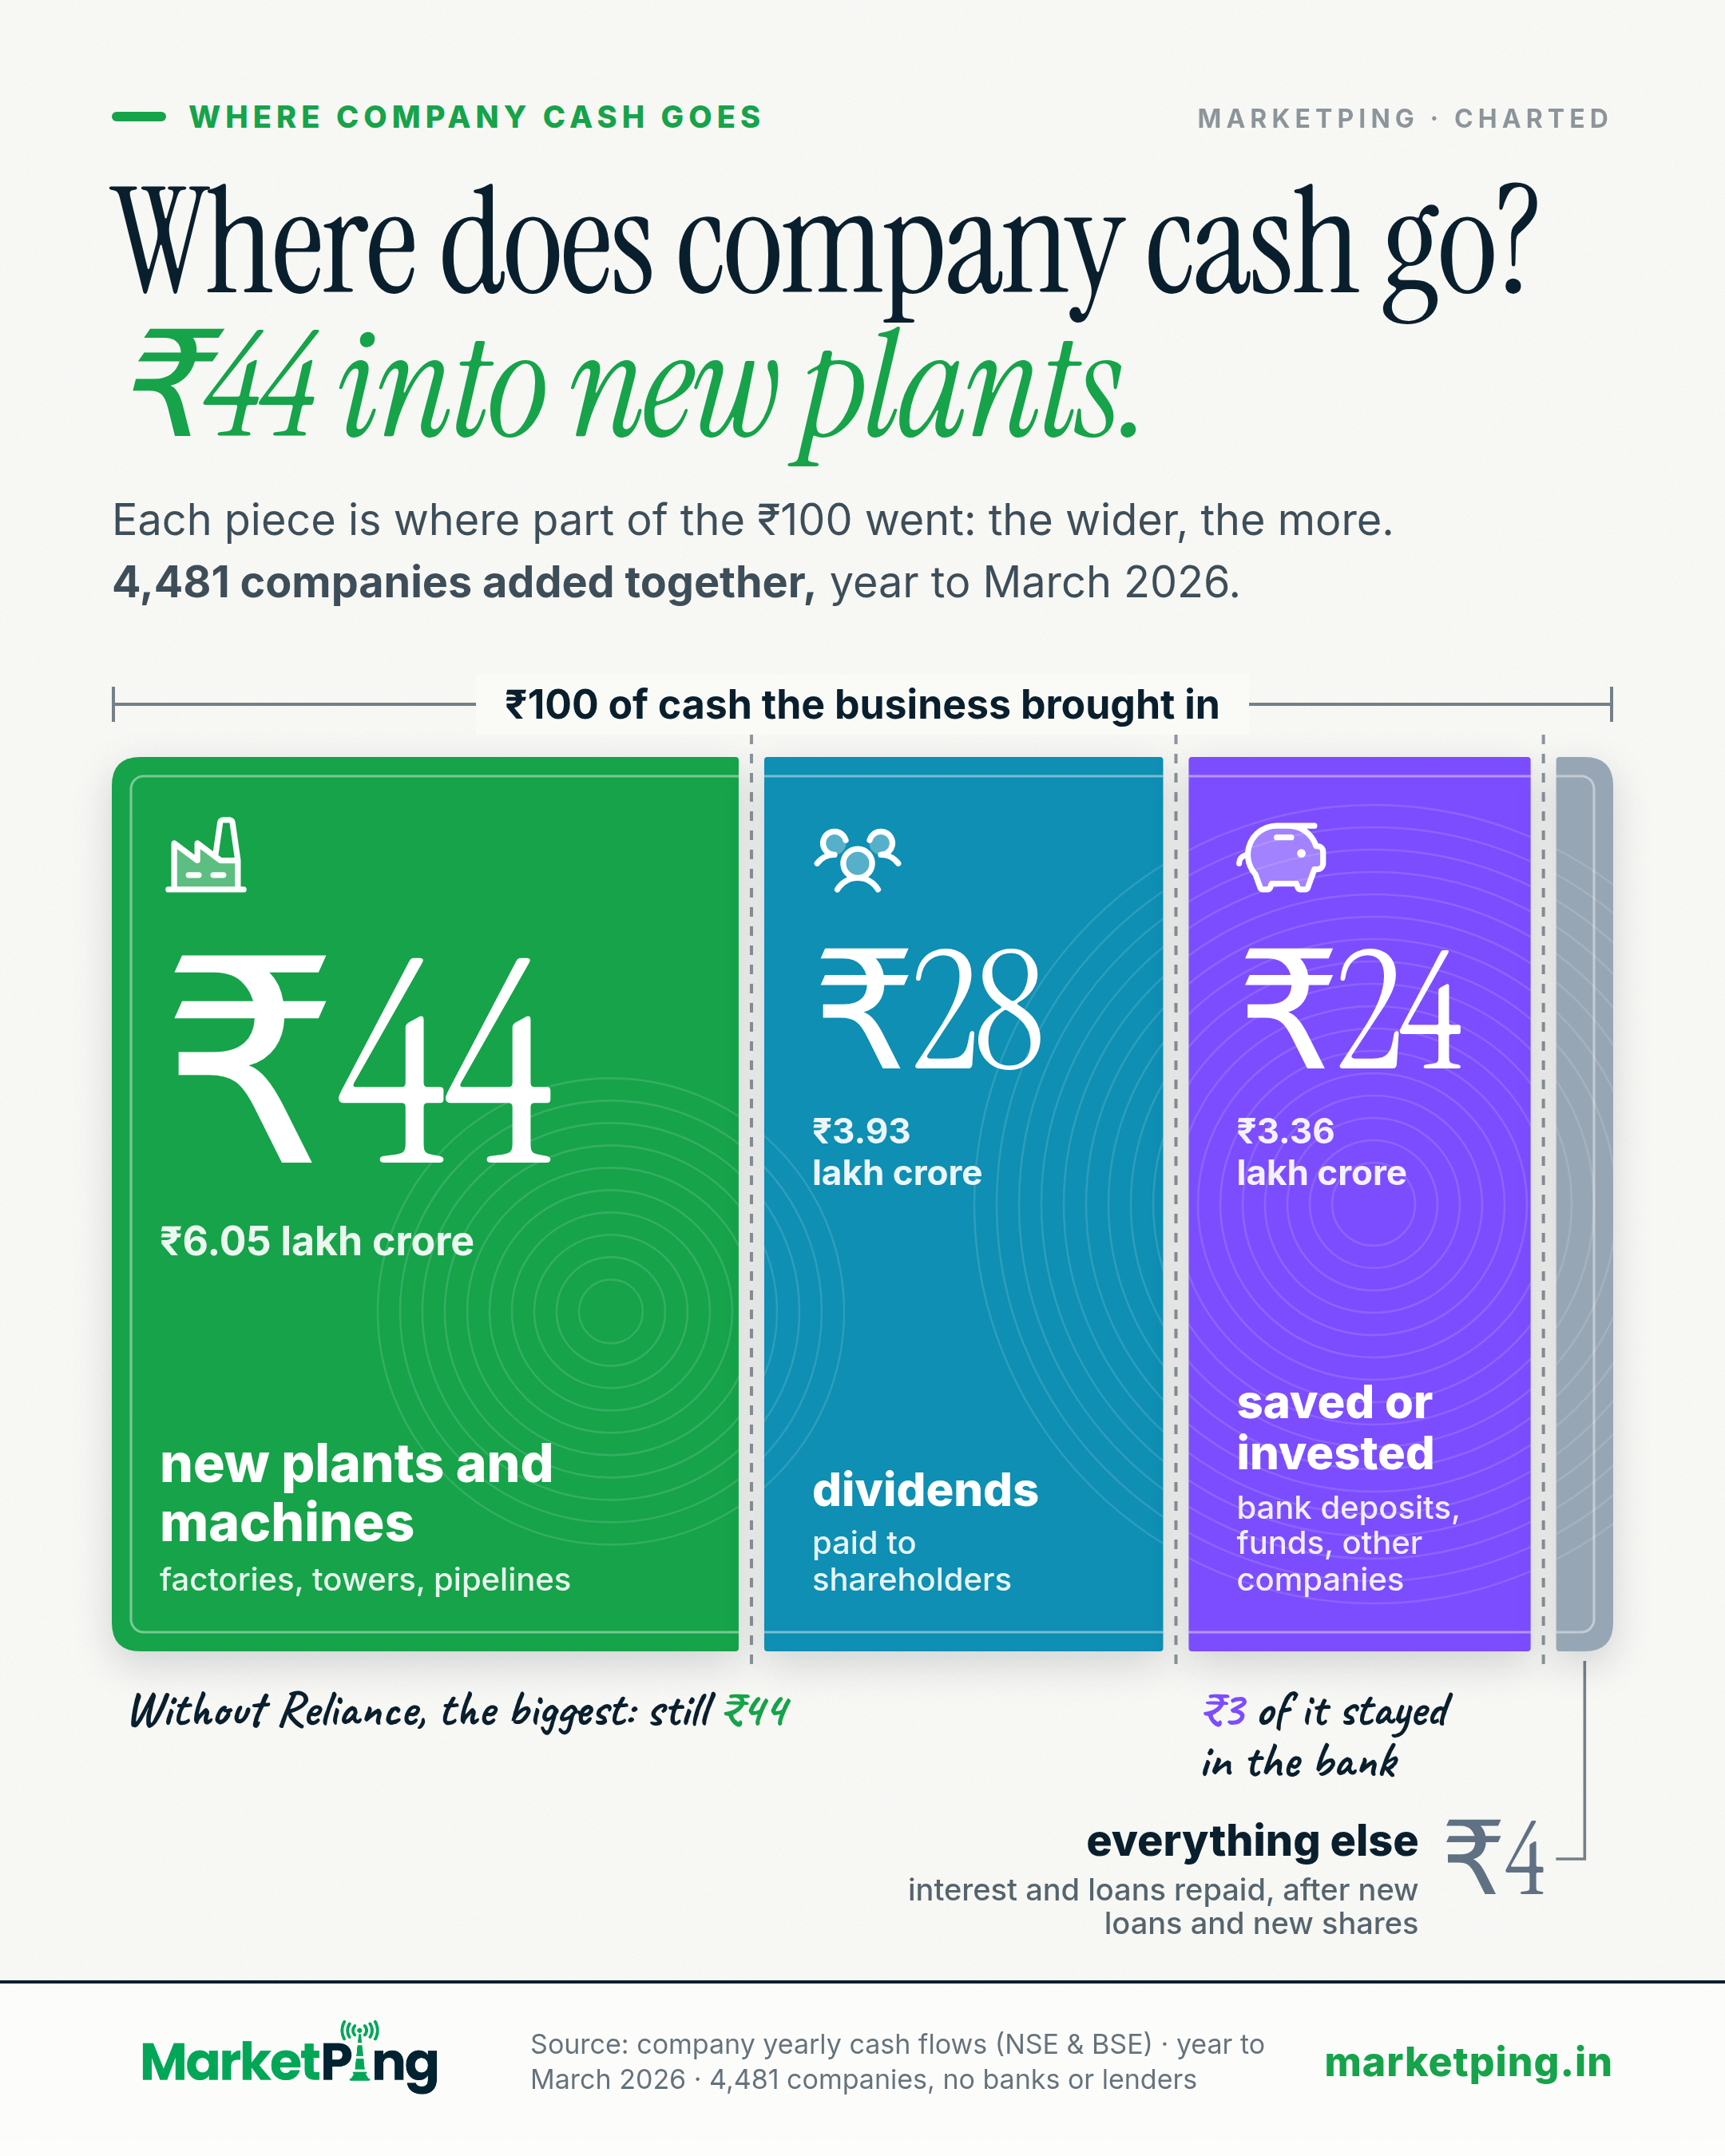
Of every ₹100 of cash that India's listed companies (leaving out banks and lenders) brought in from their business in the year to March 2026, ₹44 went into new plants and machines and ₹28 was paid out as dividends.
Where every ₹100 went (4,481 companies added together)
- ₹44 new plants and machines: factories, towers, pipelines, equipment (₹6.05 lakh crore)
- ₹28 dividends paid to shareholders (₹3.93 lakh crore)
- ₹24 saved or invested: bank deposits, funds, stakes in and loans to other companies, and cash kept (₹3.36 lakh crore; ₹3 of it stayed as cash in the bank)
- ₹4 everything else: interest paid and loans repaid, after new loans and new shares (₹0.58 lakh crore)
Together their businesses brought in ₹13.92 lakh crore of cash. 1,701 of them used more cash than they brought in, and that comes off the total. Big companies weigh more: Reliance alone brought in ₹6 of every ₹100, and without it new plants and machines still take ₹44.
What this is: cash, not profit. Profit counts a sale when it is made and a cost when it is owed. Cash counts money only when it actually comes in or goes out, so a company can show a profit and still be short of cash, for example while its customers have not paid yet. What it is not: one company's split, or a view on whether any company spends well or badly.
How it is measured
Where the cash went, for 4,481 listed companies added together, from each company's own yearly cash flow statement for the year to March 2026: the company alone, not its group (standalone), so a listed company owned by another listed company is not counted twice. The ₹100 is the cash their businesses brought in after paying suppliers, staff and tax (cash from operations), ₹13.92 lakh crore in all. Cash is not profit: profit counts a sale when it is made and a cost when it is owed, cash counts money only when it actually comes in or goes out.
New plants and machines is the money paid for land, buildings, plants, machines and equipment, the filing's own line for it (₹6.05 lakh crore); money from selling old assets (₹1.8 of every ₹100) is not taken off it. Spending a company files as other long-lasting assets (rights, licences, software and the like: intangible and other long-term assets) is not in it but in saved or invested, so if anything new plants and machines is understated. Dividends is the dividends paid in the year (₹3.93 lakh crore); a 0 in the filing is read as none paid, which is also how a company that did not fill in the line shows (3,061 companies show 0).
Saved or invested is the rest of the investing section plus the cash added in the bank (₹3.36 lakh crore): bank deposits, funds, shares of and loans to other companies, rights and software (₹1.8), less what was sold and less the interest (₹7.3) and dividends (₹7.0) the companies received on what they hold; ₹3 of it is cash added in the bank. A company that pays out the dividends its own subsidiaries pay it (Coal India is one) shows that money coming in here, not in the ₹100. Everything else is the rest of the financing section (₹0.58 lakh crore): interest paid, loans repaid, rent on leases and shares bought back, less new loans taken and new shares sold.
It is small because new money nearly matched what was paid out, and it is not steady: without the ten biggest companies it is below zero. The four pieces add to the ₹100 exactly, because cash from the business, from investing and from financing add up to the change in cash. Big companies weigh more: Reliance alone brought in ₹5.7 of every ₹100, the ten biggest ₹38.0.
Without Reliance, new plants and machines take ₹43.5 (with it ₹43.5; both print as ₹44 with the same rounding); without the ten biggest, ₹49.4. Cash burners count: 1,701 companies' businesses used more cash than they brought in (₹0.74 lakh crore), and that comes off the ₹100. Counting only the 2,778 whose businesses brought cash in, new plants and machines take ₹38.9 and dividends ₹26.2.
Left out: 720 banks, lenders, insurers and other financial companies (for them lending is the business), 30 with a cash flow line missing, 96 that filed plants or dividends with the opposite sign (in the ones we checked the whole investing section was flipped, so their split cannot be trusted; ₹1,635 crore of plants between them), and 4 whose three cash flow totals do not add up to their own change in cash. The pieces are rounded to whole rupees so they add to exactly ₹100 (largest-remainder rounding). This is arithmetic on filed cash flow statements, not a view on any company.
Using this chart
Free to quote and republish. This chart, with its text, is licensed under Creative Commons Attribution 4.0, including for commercial use and news reporting.
- Reprint the chart, or redraw it in your own style
- Quote its finding and figures
- Use it in print, online, on screen or on air
- Credit MarketPing
- Link to this page where your format allows
- Give the data date: 9 October 2026
The licence covers this page only, not the rest of MarketPing or its data. See our Terms, section 9A.
How to cite
- News storyIn print or online copy
Source: MarketPing, data as of 9 Oct 2026 (marketping.in/charts/cash-use) - Chart or broadcastUnder the chart, on screen or on air
Source: MarketPing (marketping.in) - Research paperAPA style
MarketPing. (2026, October 8). Where does company cash go? ₹44 into new plants. [Chart]. https://marketping.in/charts/cash-use
Keep the date: this chart is rebuilt every day and may read differently tomorrow.
More on more charts
Facts from public exchange data and company filings. Not investment advice, and not a recommendation about any security. For frozen, citable findings with a full method, see our studies.