
How much did company sales grow? ₹100 became ₹107.
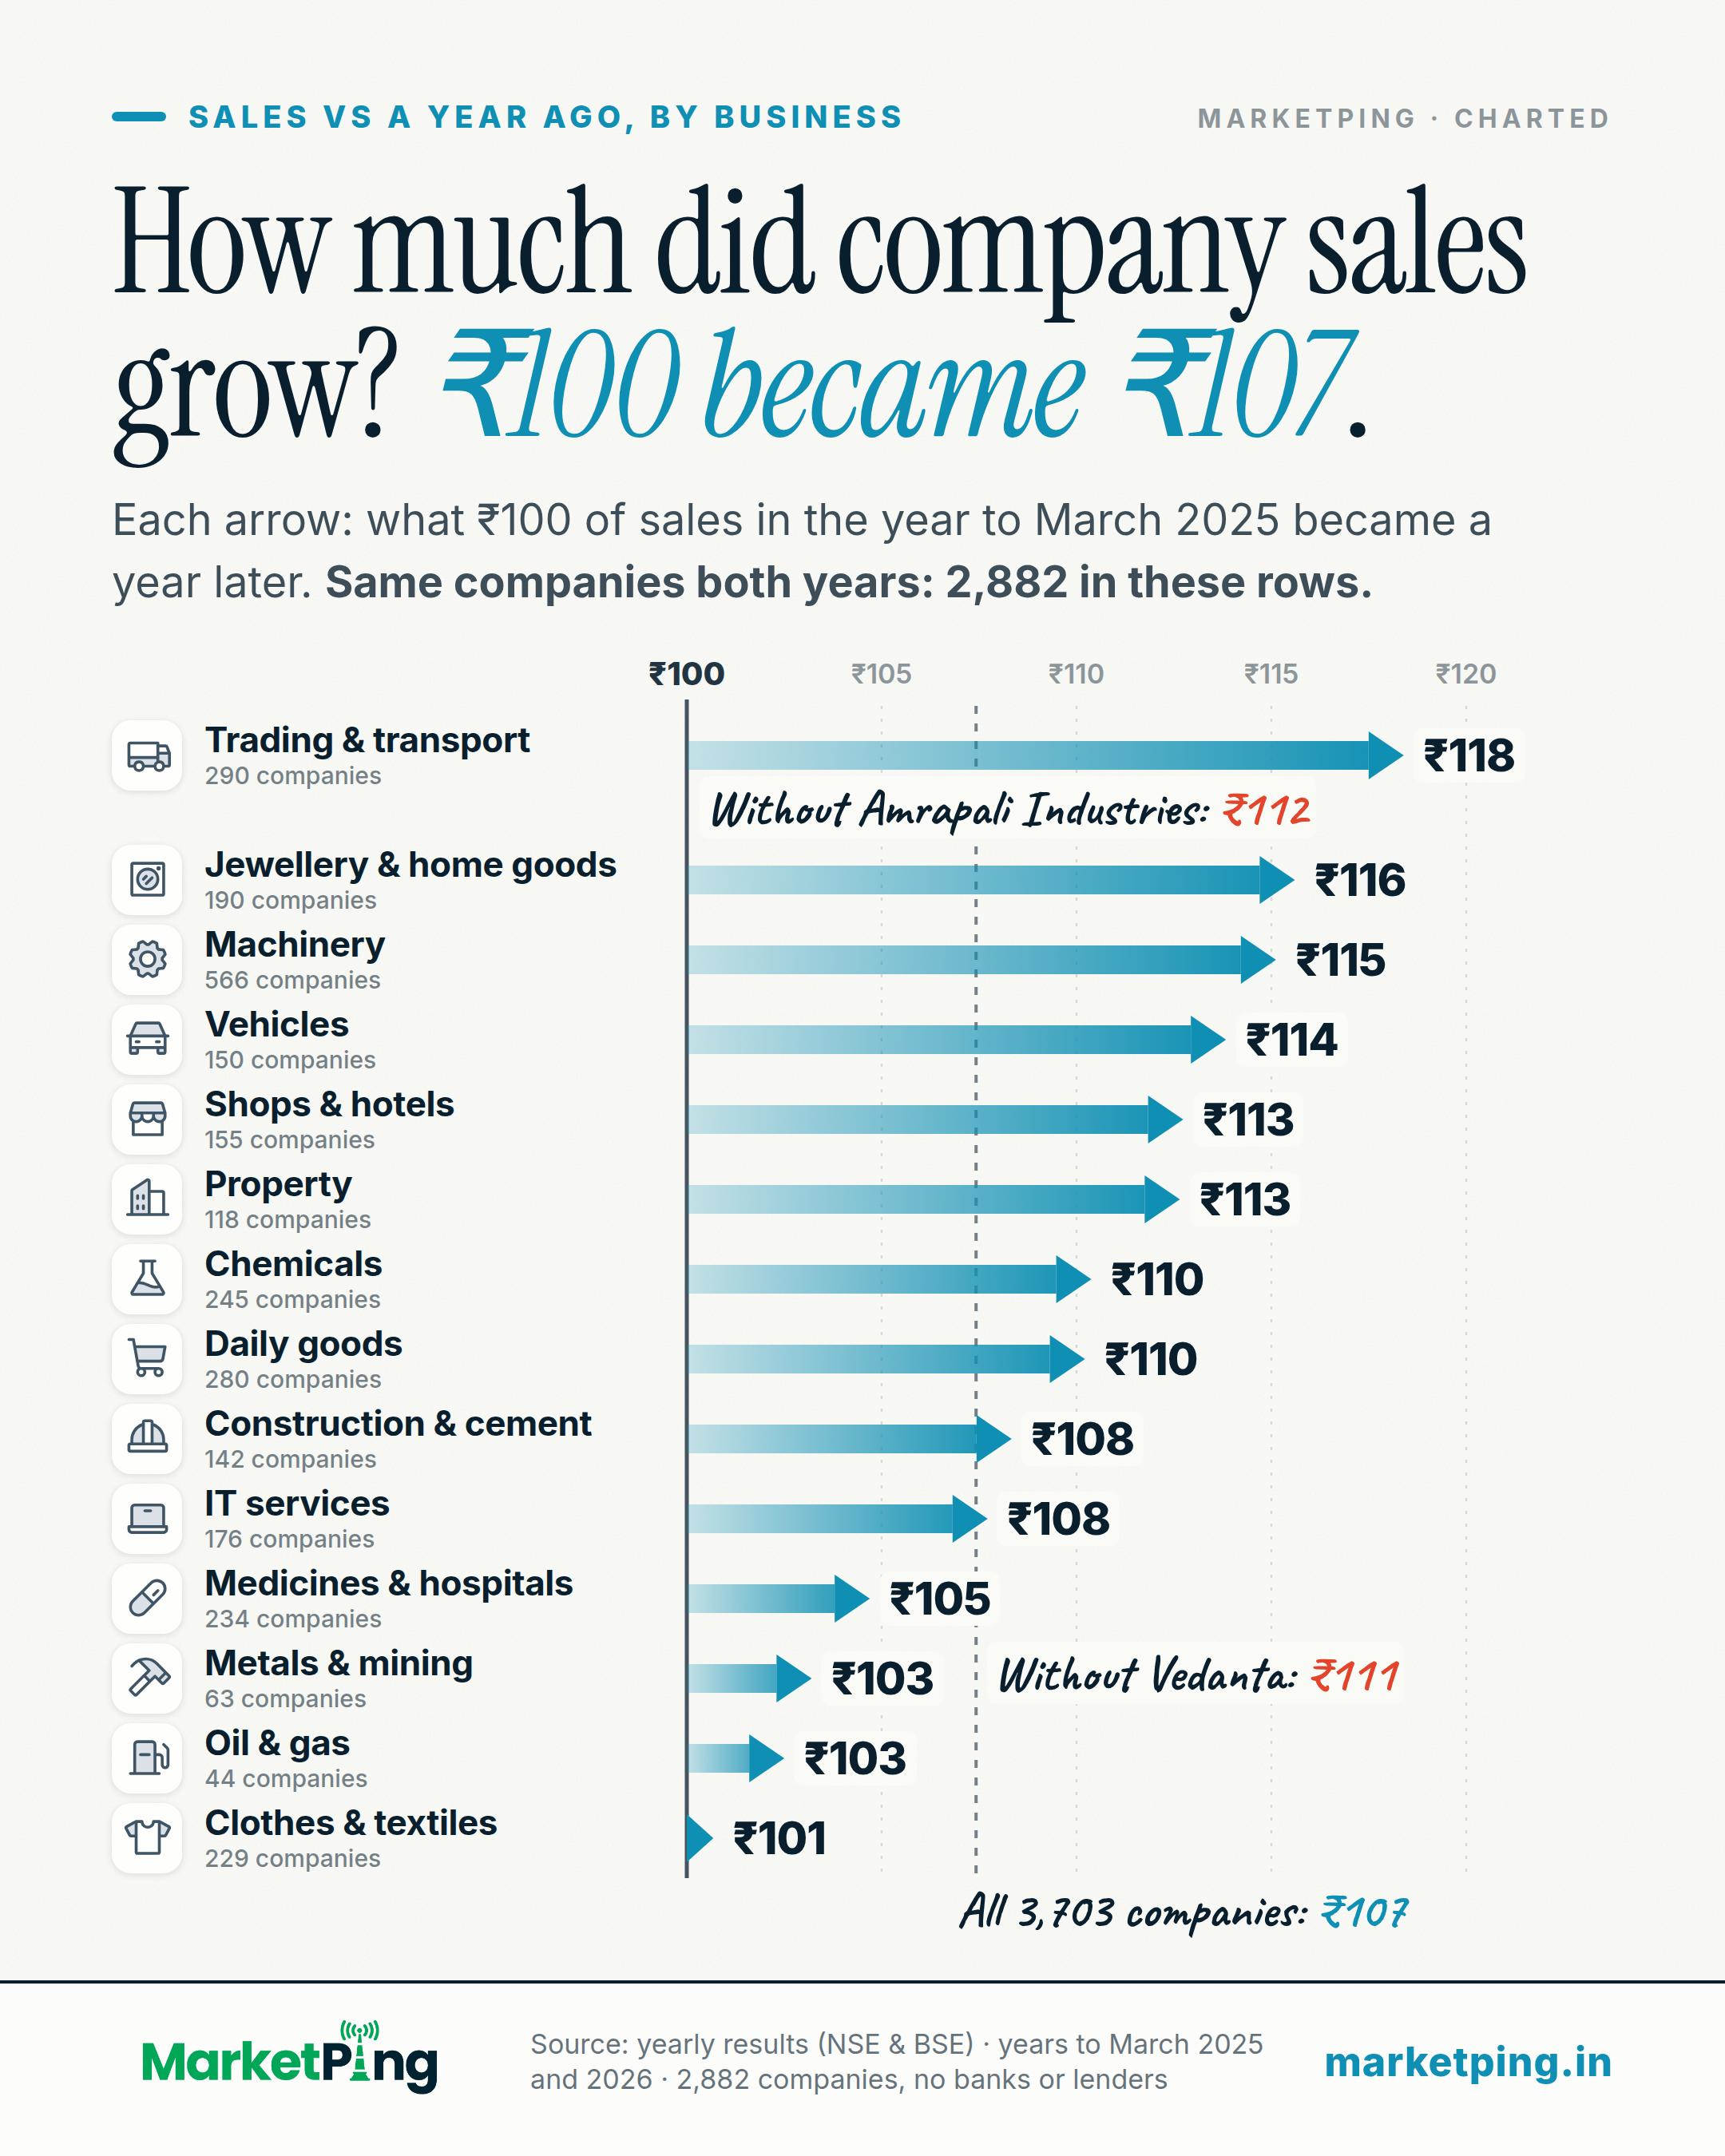
Each arrow: what ₹100 of sales in the year to March 2025 became a year later. Same companies both years: 2,882 in these rows.
What the chart shows
In the year to March 2026, 3,703 companies added together sold ₹107 for every ₹100 they sold the year before. 2,506 of the 3,703 sold more than a year earlier.
Sales for every ₹100 a year earlier, by industry
| Trading & transport | ₹100 → ₹118 (290 companies) |
|---|---|
| Jewellery & home goods | ₹100 → ₹116 (190 companies) |
| Machinery | ₹100 → ₹115 (566 companies) |
| Vehicles | ₹100 → ₹114 (150 companies) |
| Shops & hotels | ₹100 → ₹113 (155 companies) |
| Property | ₹100 → ₹113 (118 companies) |
| Chemicals | ₹100 → ₹110 (245 companies) |
| Daily goods | ₹100 → ₹110 (280 companies) |
| Construction & cement | ₹100 → ₹108 (142 companies) |
| IT services | ₹100 → ₹108 (176 companies) |
| Medicines & hospitals | ₹100 → ₹105 (234 companies) |
| Metals & mining | ₹100 → ₹103 (63 companies) |
| Oil & gas | ₹100 → ₹103 (44 companies) |
| Clothes & textiles | ₹100 → ₹101 (229 companies) |
Smaller industries, not drawn: Paper ₹109 (47 companies), Media ₹103 (71 companies). Left out: mixed businesses (13 companies), telecom (27 companies), power (46 companies), too few companies or one company too big to add up fairly. Is it one company? In some rows, yes: trading and transport ₹112 without Amrapali Industries (₹118 with it); jewellery and home goods ₹111 without Titan (₹116 with it); metals and mining ₹111 without Vedanta (₹103 with it). That is why no single industry is called the fastest.
What this is: each company's own yearly accounts, all the companies in an industry added together, the same companies in both years. Sales are what the business sold, not other income. Higher prices and selling more both count. Banks and lenders are left out. Big companies weigh more than small ones. What it is not: profit, or any one company's sales.
How it is measured
Sales in the year to March 2026 for every ₹100 the same companies sold in the year to March 2025, industry by industry, from each company's own yearly accounts: the company alone, not its group (standalone), so a listed company owned by another listed company is not counted twice. Sales are the accounts' revenue from operations: what the business sold, not other income such as interest received. Higher prices and selling more both raise it.
An industry's figure is all its companies' sales in the later year added together, divided by the same companies' sales the year before, so big companies weigh more than small ones. Only companies with yearly accounts for both years count (3,703): left out are 723 banks, lenders, insurers and other financial companies, 351 with no accounts for the earlier year (most listed recently), 368 with no sales in one of the years, and 186 whose sales rose more than four times or fell by more than four-fifths, which is usually a merger, a business split off, a one-off or a slip in the data; the largest of those: Tejas Networks (₹8,916 crore to ₹1,101 crore), Shankara Building Products (₹5,267 crore to ₹129 crore), Embassy Developments (₹2,112 crore to ₹412 crore). A business split off part-way can still pull an industry down without reaching that line.
Industry is the industry group on file for each company, in plain words; Power includes water and waste companies, Construction & cement joins builders and cement makers, Jewellery & home goods is jewellery, paint, appliances and other things for the home, and Trading & transport is traders, airlines, logistics, ports, staffing and office services. 617 of the 3,703 companies have no industry on file and are in no row (together ₹116); they are in the all-company ₹107. An industry is drawn only with at least 40 companies and no one company above 40% of its sales, else the row would be one company's result. Left out on that rule: Mixed businesses (13 companies; DCM Shriram is 48% of its sales), Telecom (27 companies; Airtel is 52% of its sales), Power (46 companies; NTPC is 42% of its sales).
The chart shows the 14 biggest industries by sales (91% of all the sales counted); the smaller ones are in the post text. No industry is named as the fastest: leave out a single company and the order at the top changes (trading and transport ₹112 without Amrapali Industries; jewellery and home goods ₹111 without Titan), so the headline gives the all-company figure instead, which stays at ₹107-₹108 whichever single company is left out. Arrows are drawn from the exact figure; the printed rupees are rounded to whole rupees.
This is arithmetic on filed accounts, not a view on any company or industry.
Using this chart
Free to quote and republish. This chart, with its text, is licensed under Creative Commons Attribution 4.0, including for commercial use and news reporting.
- Reprint the chart, or redraw it in your own style
- Quote its finding and figures
- Use it in print, online, on screen or on air
- Credit MarketPing
- Link to this page where your format allows
- Give the data date: 9 October 2026
The licence covers this page only, not the rest of MarketPing or its data. See our Terms, section 9A.
How to cite
- News storyIn print or online copy
Source: MarketPing, data as of 9 Oct 2026 (marketping.in/charts/sales-growth) - Chart or broadcastUnder the chart, on screen or on air
Source: MarketPing (marketping.in) - Research paperAPA style
MarketPing. (2026, October 8). How much did company sales grow? ₹100 became ₹107. [Chart]. https://marketping.in/charts/sales-growth
Keep the date: this chart is rebuilt every day and may read differently tomorrow.
More on more charts
Facts from public exchange data and company filings. Not investment advice, and not a recommendation about any security. For frozen, citable findings with a full method, see our studies.