
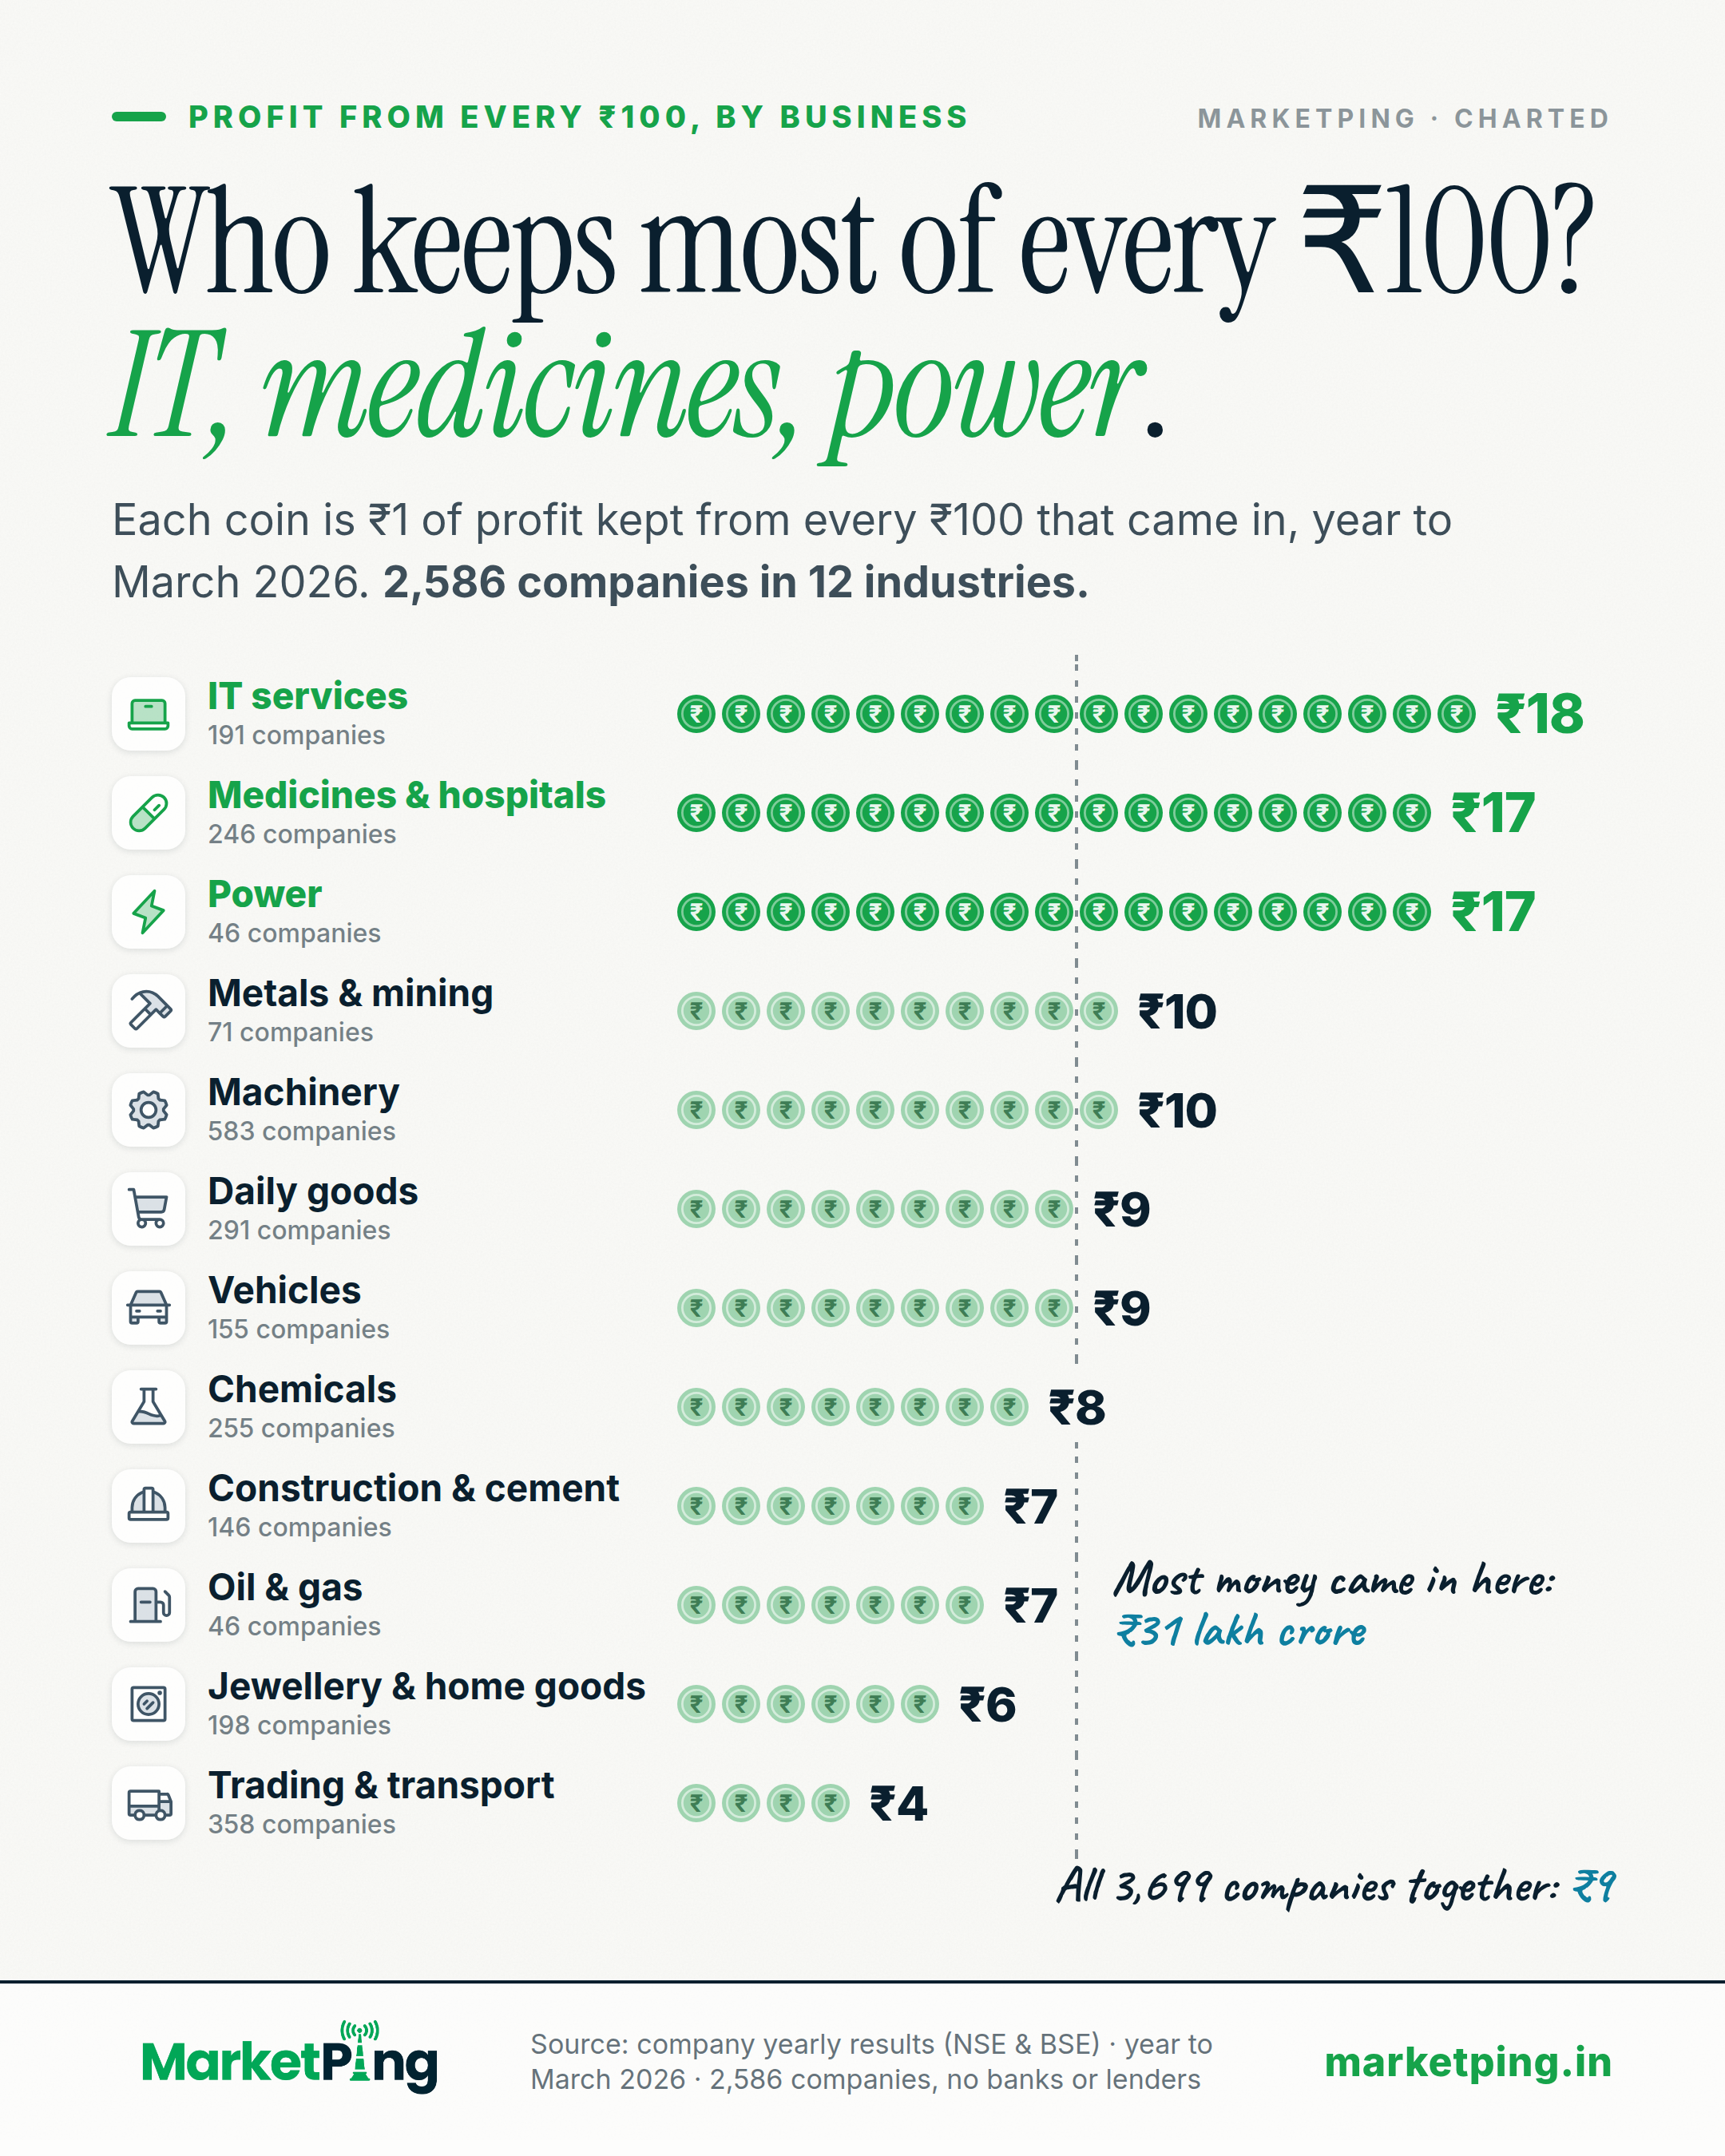
Who keeps most of every ₹100? IT, medicines, power.
Each coin is ₹1 of profit kept from every ₹100 that came in, year to March 2026. 2,586 companies in 12 industries.
What the chart shows
In the year to March 2026, IT, medicine and power companies kept the most profit from every ₹100 that came in: ₹18, ₹17 and ₹17. All 3,699 companies added together kept ₹9.
Profit kept from every ₹100, by industry
| IT services | ₹18 (191 companies) |
|---|---|
| Medicines & hospitals | ₹17 (246 companies) |
| Power | ₹17 (46 companies, 12 of them water and waste) |
| Metals & mining | ₹10 (71 companies) |
| Machinery | ₹10 (583 companies) |
| Daily goods | ₹9 (291 companies) |
| Vehicles | ₹9 (155 companies) |
| Chemicals | ₹8 (255 companies) |
| Construction & cement | ₹7 (146 companies) |
| Oil & gas | ₹7 (46 companies) |
| Jewellery & home goods | ₹6 (198 companies) |
| Trading & transport | ₹4 (358 companies) |
Smaller industries, not drawn: Property ₹15 (149 companies), Shops & hotels ₹8 (157 companies), Media ₹7 (78 companies), Clothes & textiles ₹4 (257 companies), Paper ₹3 (49 companies). Left out: mixed businesses (13 companies) and telecom (29 companies), too few companies to add up fairly. Why three names: leave out each industry's biggest company and the order changes (IT services without TCS: ₹16; Medicines & hospitals without Dr Reddy's: ₹18; Power without NTPC: ₹18). All three stay above every other industry either way.
What this is: each company's own yearly accounts, all the companies in an industry added together, losses included. Banks and lenders are left out. Big companies weigh more than small ones. What it is not: any one company's profit, or a reason to buy a share.
How it is measured
Profit kept from every ₹100 that came in, industry by industry, for the year to March 2026, from each company's own yearly accounts: the company alone, not its group (standalone), so a listed company owned by another listed company is not counted twice. The definitions are the same as on our "companies keep ₹9 of every ₹100" poster: the ₹100 is everything a company took in (sales plus other income such as interest received); profit is what is left after all costs and tax on profit; one-off gains and costs are kept out; losses count. An industry's figure is all its companies' profit added together divided by all their income added together, so big companies weigh more than small ones. 3,699 companies pass (the same 3,699 as the ₹9 poster): left out are 720 banks, lenders, insurers and other financial companies, 79 with no income, 833 with a line missing from their filing.
Industry is the industry group on file for each company, in plain words; Power includes water and waste companies, Construction & cement joins builders and cement makers, and Jewellery & home goods is jewellery, paint, appliances and other things for the home. 381 of the 3,699 companies have no industry on file and are in no row (together they kept ₹0.4 of every ₹100); they are in the all-company ₹9. An industry is drawn only with at least 40 companies and no one company above 40% of its income, else the row would be one company's result. Left out on that rule: Mixed businesses (13 companies, and DCM Shriram is 47% of its money), Telecom (29 companies, and Airtel is 51% of its money).
The chart shows the 12 biggest by money taken in (91% of all the income); smaller ones are in the post text. The top three are named in the headline only because each stays above every other industry even with each industry's biggest company left out (IT services without TCS: ₹16; Medicines & hospitals without Dr Reddy's: ₹18; Power without NTPC: ₹18). Coins are rounded to whole rupees.
This is arithmetic on filed accounts, not a view on any company or industry.
Using this chart
Free to quote and republish. This chart, with its text, is licensed under Creative Commons Attribution 4.0, including for commercial use and news reporting.
- Reprint the chart, or redraw it in your own style
- Quote its finding and figures
- Use it in print, online, on screen or on air
- Credit MarketPing
- Link to this page where your format allows
- Give the data date: 7 October 2026
The licence covers this page only, not the rest of MarketPing or its data. See our Terms, section 9A.
How to cite
- News storyIn print or online copy
Source: MarketPing, data as of 7 Oct 2026 (marketping.in/charts/sector-keep) - Chart or broadcastUnder the chart, on screen or on air
Source: MarketPing (marketping.in) - Research paperAPA style
MarketPing. (2026, October 6). Who keeps most of every ₹100? IT, medicines, power. [Chart]. https://marketping.in/charts/sector-keep
Keep the date: this chart is rebuilt every day and may read differently tomorrow.
More on more charts


Facts from public exchange data and company filings. Not investment advice, and not a recommendation about any security. For frozen, citable findings with a full method, see our studies.