
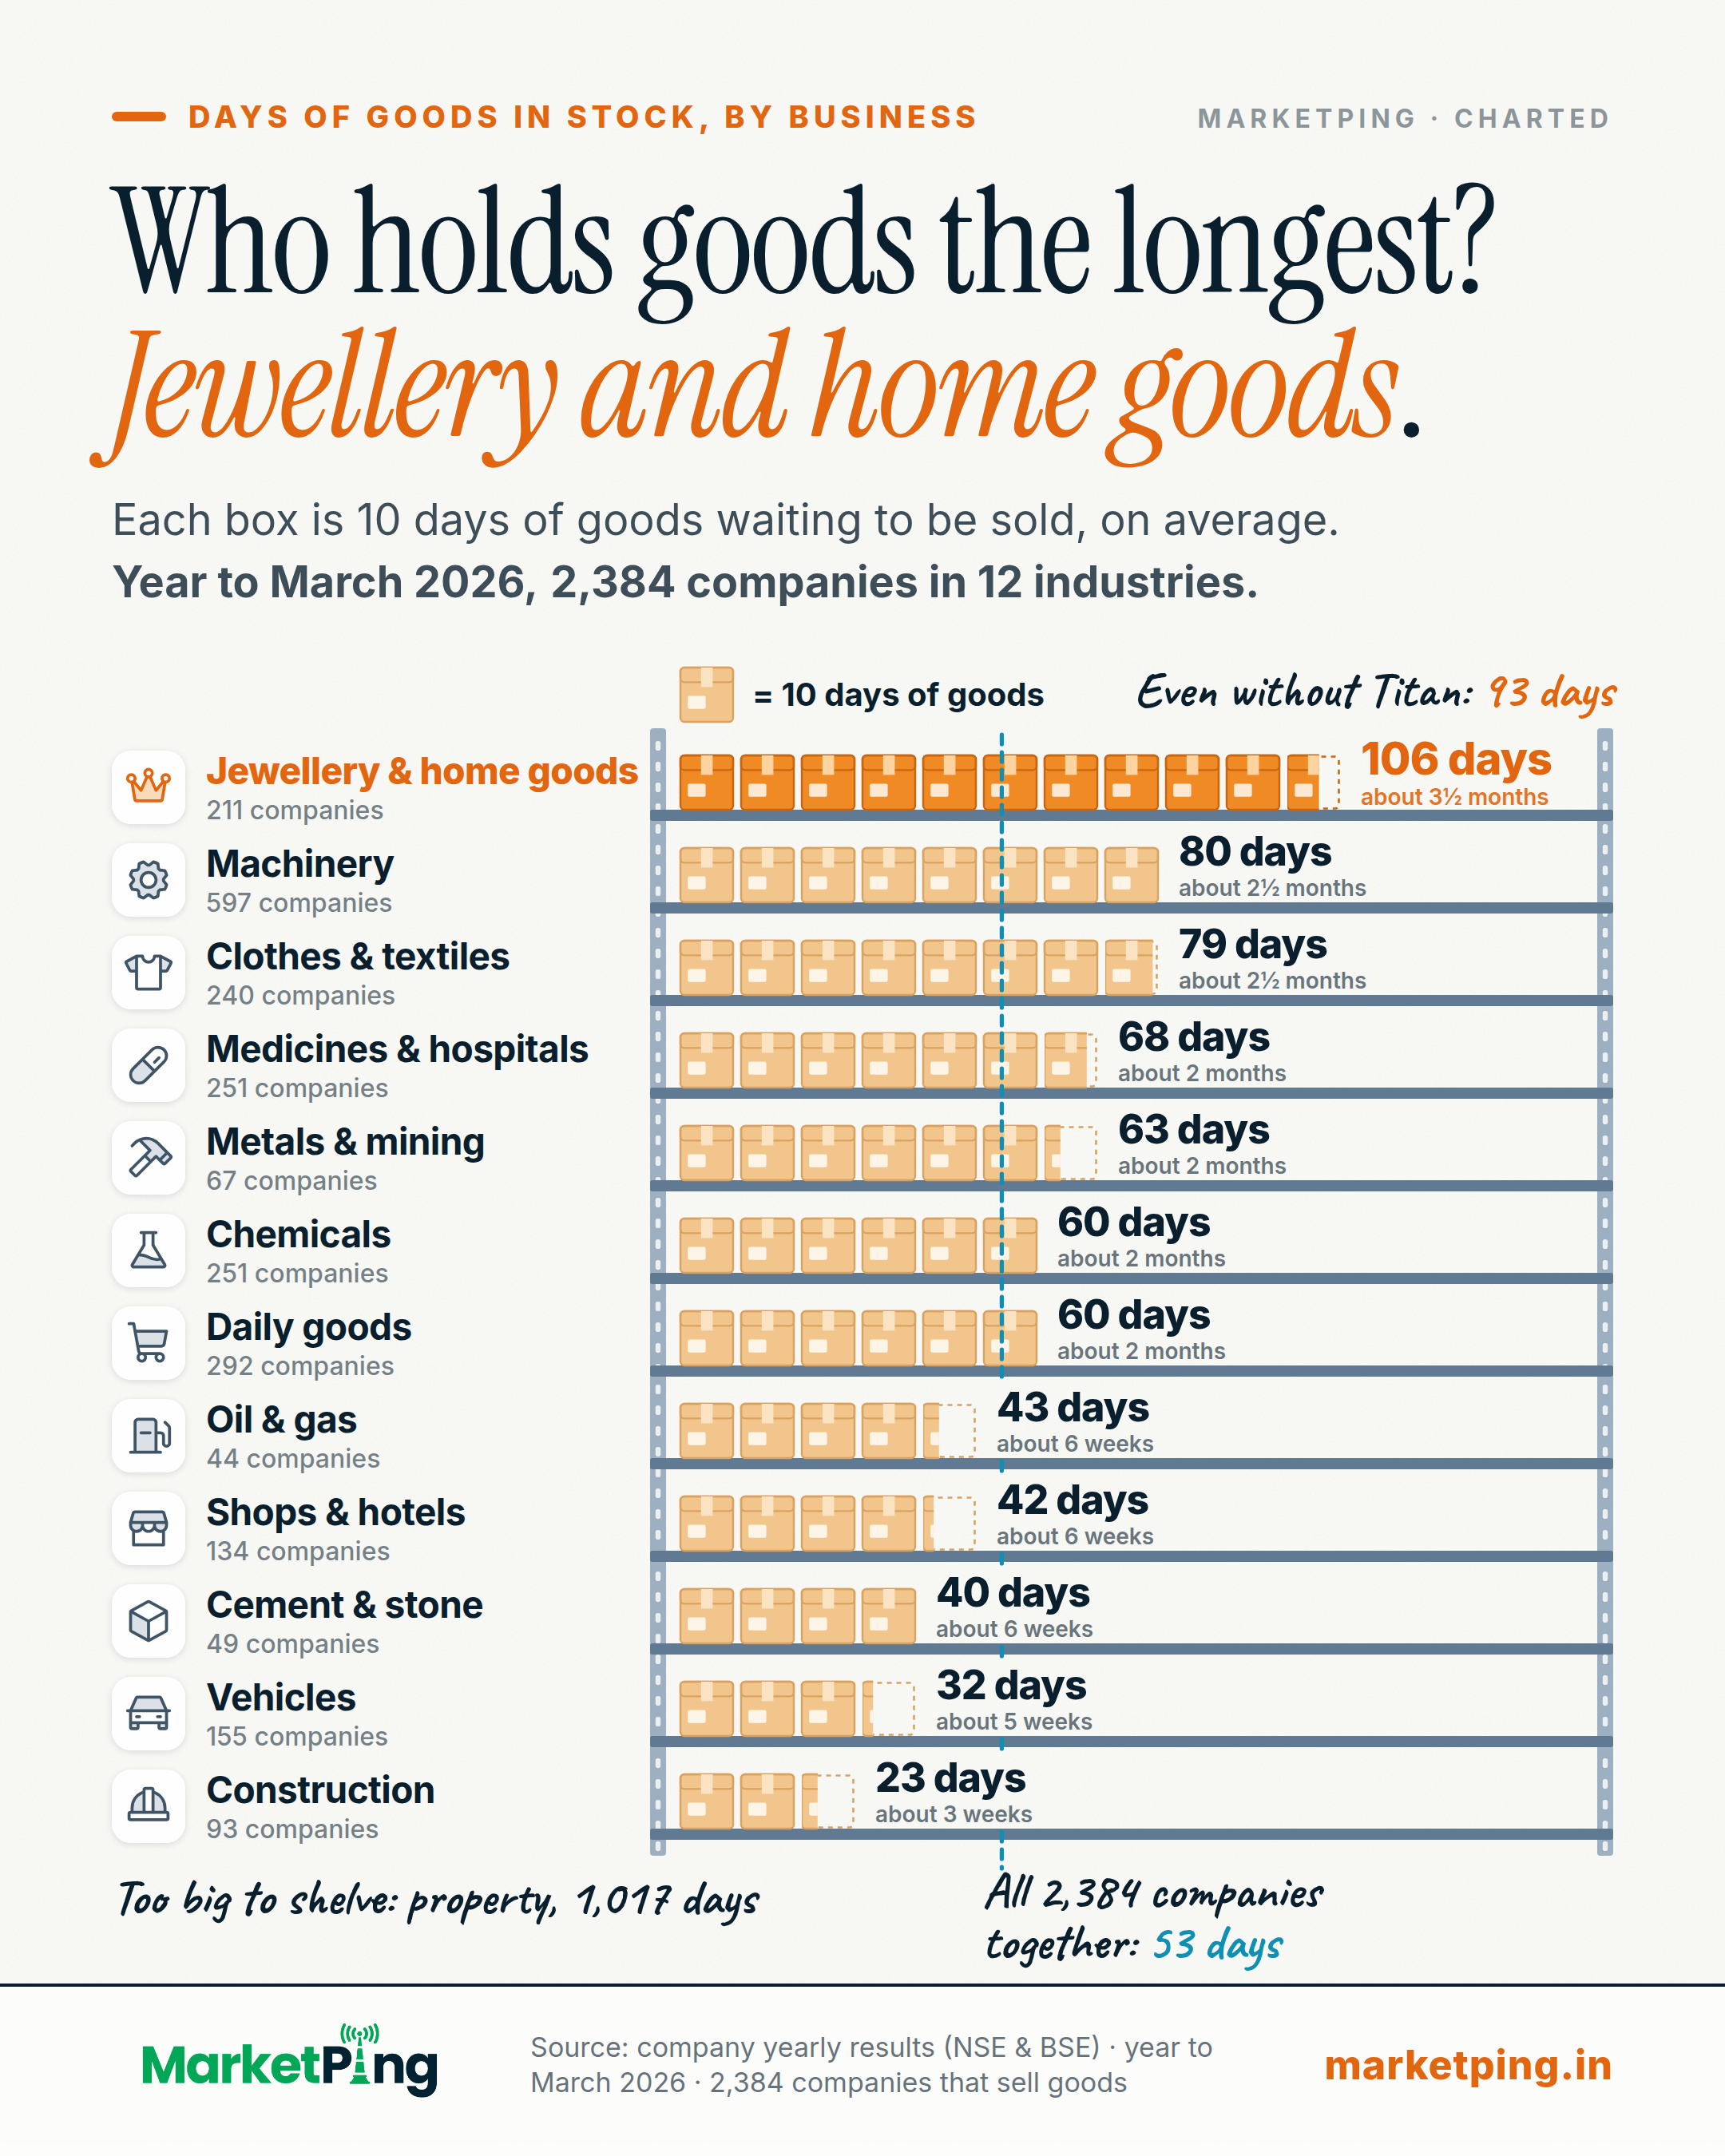
Who holds goods the longest? Jewellery and home goods.
Each box is 10 days of goods waiting to be sold, on average. Year to March 2026, 2,384 companies in 12 industries.
What the chart shows
In the year to March 2026, jewellery and home goods companies held their goods the longest before selling: 106 days on average, about 3½ months. Construction companies held 23 days. All 2,384 companies on the shelves together: 53 days.
Days of goods in stock, by industry
| Jewellery & home goods | 106 days (211 companies) |
|---|---|
| Machinery | 80 days (597 companies) |
| Clothes & textiles | 79 days (240 companies) |
| Medicines & hospitals | 68 days (251 companies) |
| Metals & mining | 63 days (67 companies) |
| Chemicals | 60 days (251 companies) |
| Daily goods | 60 days (292 companies) |
| Oil & gas | 43 days (44 companies) |
| Shops & hotels | 42 days (134 companies) |
| Cement & stone | 40 days (49 companies) |
| Vehicles | 32 days (155 companies) |
| Construction | 23 days (93 companies) |
Jewellers alone (73 companies) held 162 days of goods, about 5½ months; 160 days without Titan, which is 43% of their sales. Because one company is that big a part, they are not a shelf of their own. Smaller industries, not drawn: Paper 67 days (45 companies). Not drawn: property developers, 1,017 days (125 companies). Their stock is land and homes being built, which take years to finish and sell, so it is a different kind of stock. Not drawn: businesses that mostly sell a service, where at least one in three companies hold no goods at all: Media (37 of 83), Trading & transport (149 of 360) and IT services (129 of 210). Left out: mixed businesses (13 companies), power (44 companies; NTPC alone is 43% of its sales) and telecom (21 companies): too few companies, or one company too big to add up fairly. Is it just one big company? No: leave out Titan and jewellery and home goods companies still held 93 days. Why construction is short: building contractors keep unfinished work they have not yet billed in a separate line of their accounts, not in goods held, so it is not on their shelf.
How it is worked out: the goods a company held at the year end (raw materials, half-made and finished goods), divided by its sales for the year, times 365 days. All the companies in an industry are added together, so big companies weigh more. Only companies that reported both figures above zero are counted. Banks and lenders are left out. What it is not: one company's figure, or a sign of slow sales. Some businesses must hold goods for months: a jeweller keeps gold on display, a machine maker builds for months before it delivers. And it is not a reason to buy a share.
How it is measured
Days of goods in stock, industry by industry, for the year to March 2026, from each company's own yearly accounts: the company alone, not its group (standalone), so a listed company owned by another listed company is not counted twice. For each industry: the goods its companies held at the year end (inventories on the balance sheet: raw materials, half-made goods, finished goods and goods bought to resell), all its companies added together, divided by all their sales for the year added together, times 365 days. So it is an average, set from one year-end snapshot against a whole year of sales; big companies weigh more than small ones.
It is measured against sales, the same yardstick for every industry. Holding goods longer is not slow sales or a problem by itself: a jeweller must keep gold on display, a machine maker builds for months before delivery. Building contractors keep unfinished work they have not yet billed in a separate line (contract assets), not in goods held, so it is not on their shelf.
Only companies with both figures above zero are counted (3,585): left out are 720 banks, lenders, insurers and other financial companies, 293 with no sales, 2 that did not report goods held and 731 that reported zero (a zero can mean "not reported", so it is not read as "no goods"). Industries that mostly sell a service are not drawn: where at least one in three companies hold no goods at all. That leaves out Media (37 of 83 companies hold no goods), Trading & transport (149 of 360 companies hold no goods) and IT services (129 of 210 companies hold no goods).
Property developers are not drawn either: their stock is land and homes being built, held for years by design, a different kind of stock (125 companies, 1,017 days). Industry is the industry group on file for each company, in plain words; Jewellery & home goods is jewellery, watches, paint, appliances, furniture and other things for the home; Power includes water and waste companies. 616 counted companies have no industry on file and are on no shelf. An industry is drawn only with at least 40 companies and no one company above 40% of its sales, else the shelf would be one company's result.
Left out on that rule: Mixed businesses (13 companies), Power (44 companies; NTPC is 43% of its sales), Telecom (21 companies). The chart shows the top industry and then the biggest industries by sales, 12 in all (85% of the counted sales); the smaller ones are in the post text. The dashed line is all 2,384 companies on the shelves added together.
The top industry is named in the headline only because it stays above every other industry even with each industry's biggest company left out (Jewellery & home goods without Titan: 93 days). 82 companies on the shelves held goods worth more than a whole year of sales; they are kept (all shelves: 53 days without them). One box is 10 days; the last box of a shelf is cut to its exact share; days are rounded to whole days. This is arithmetic on filed accounts, not a view on any company or industry.
Using this chart
Free to quote and republish. This chart, with its text, is licensed under Creative Commons Attribution 4.0, including for commercial use and news reporting.
- Reprint the chart, or redraw it in your own style
- Quote its finding and figures
- Use it in print, online, on screen or on air
- Credit MarketPing
- Link to this page where your format allows
- Give the data date: 8 October 2026
The licence covers this page only, not the rest of MarketPing or its data. See our Terms, section 9A.
How to cite
- News storyIn print or online copy
Source: MarketPing, data as of 8 Oct 2026 (marketping.in/charts/stock-days) - Chart or broadcastUnder the chart, on screen or on air
Source: MarketPing (marketping.in) - Research paperAPA style
MarketPing. (2026, October 7). Who holds goods the longest? Jewellery and home goods. [Chart]. https://marketping.in/charts/stock-days
Keep the date: this chart is rebuilt every day and may read differently tomorrow.
More on more charts



Facts from public exchange data and company filings. Not investment advice, and not a recommendation about any security. For frozen, citable findings with a full method, see our studies.