
16 of 19 industries borrowed more over three years
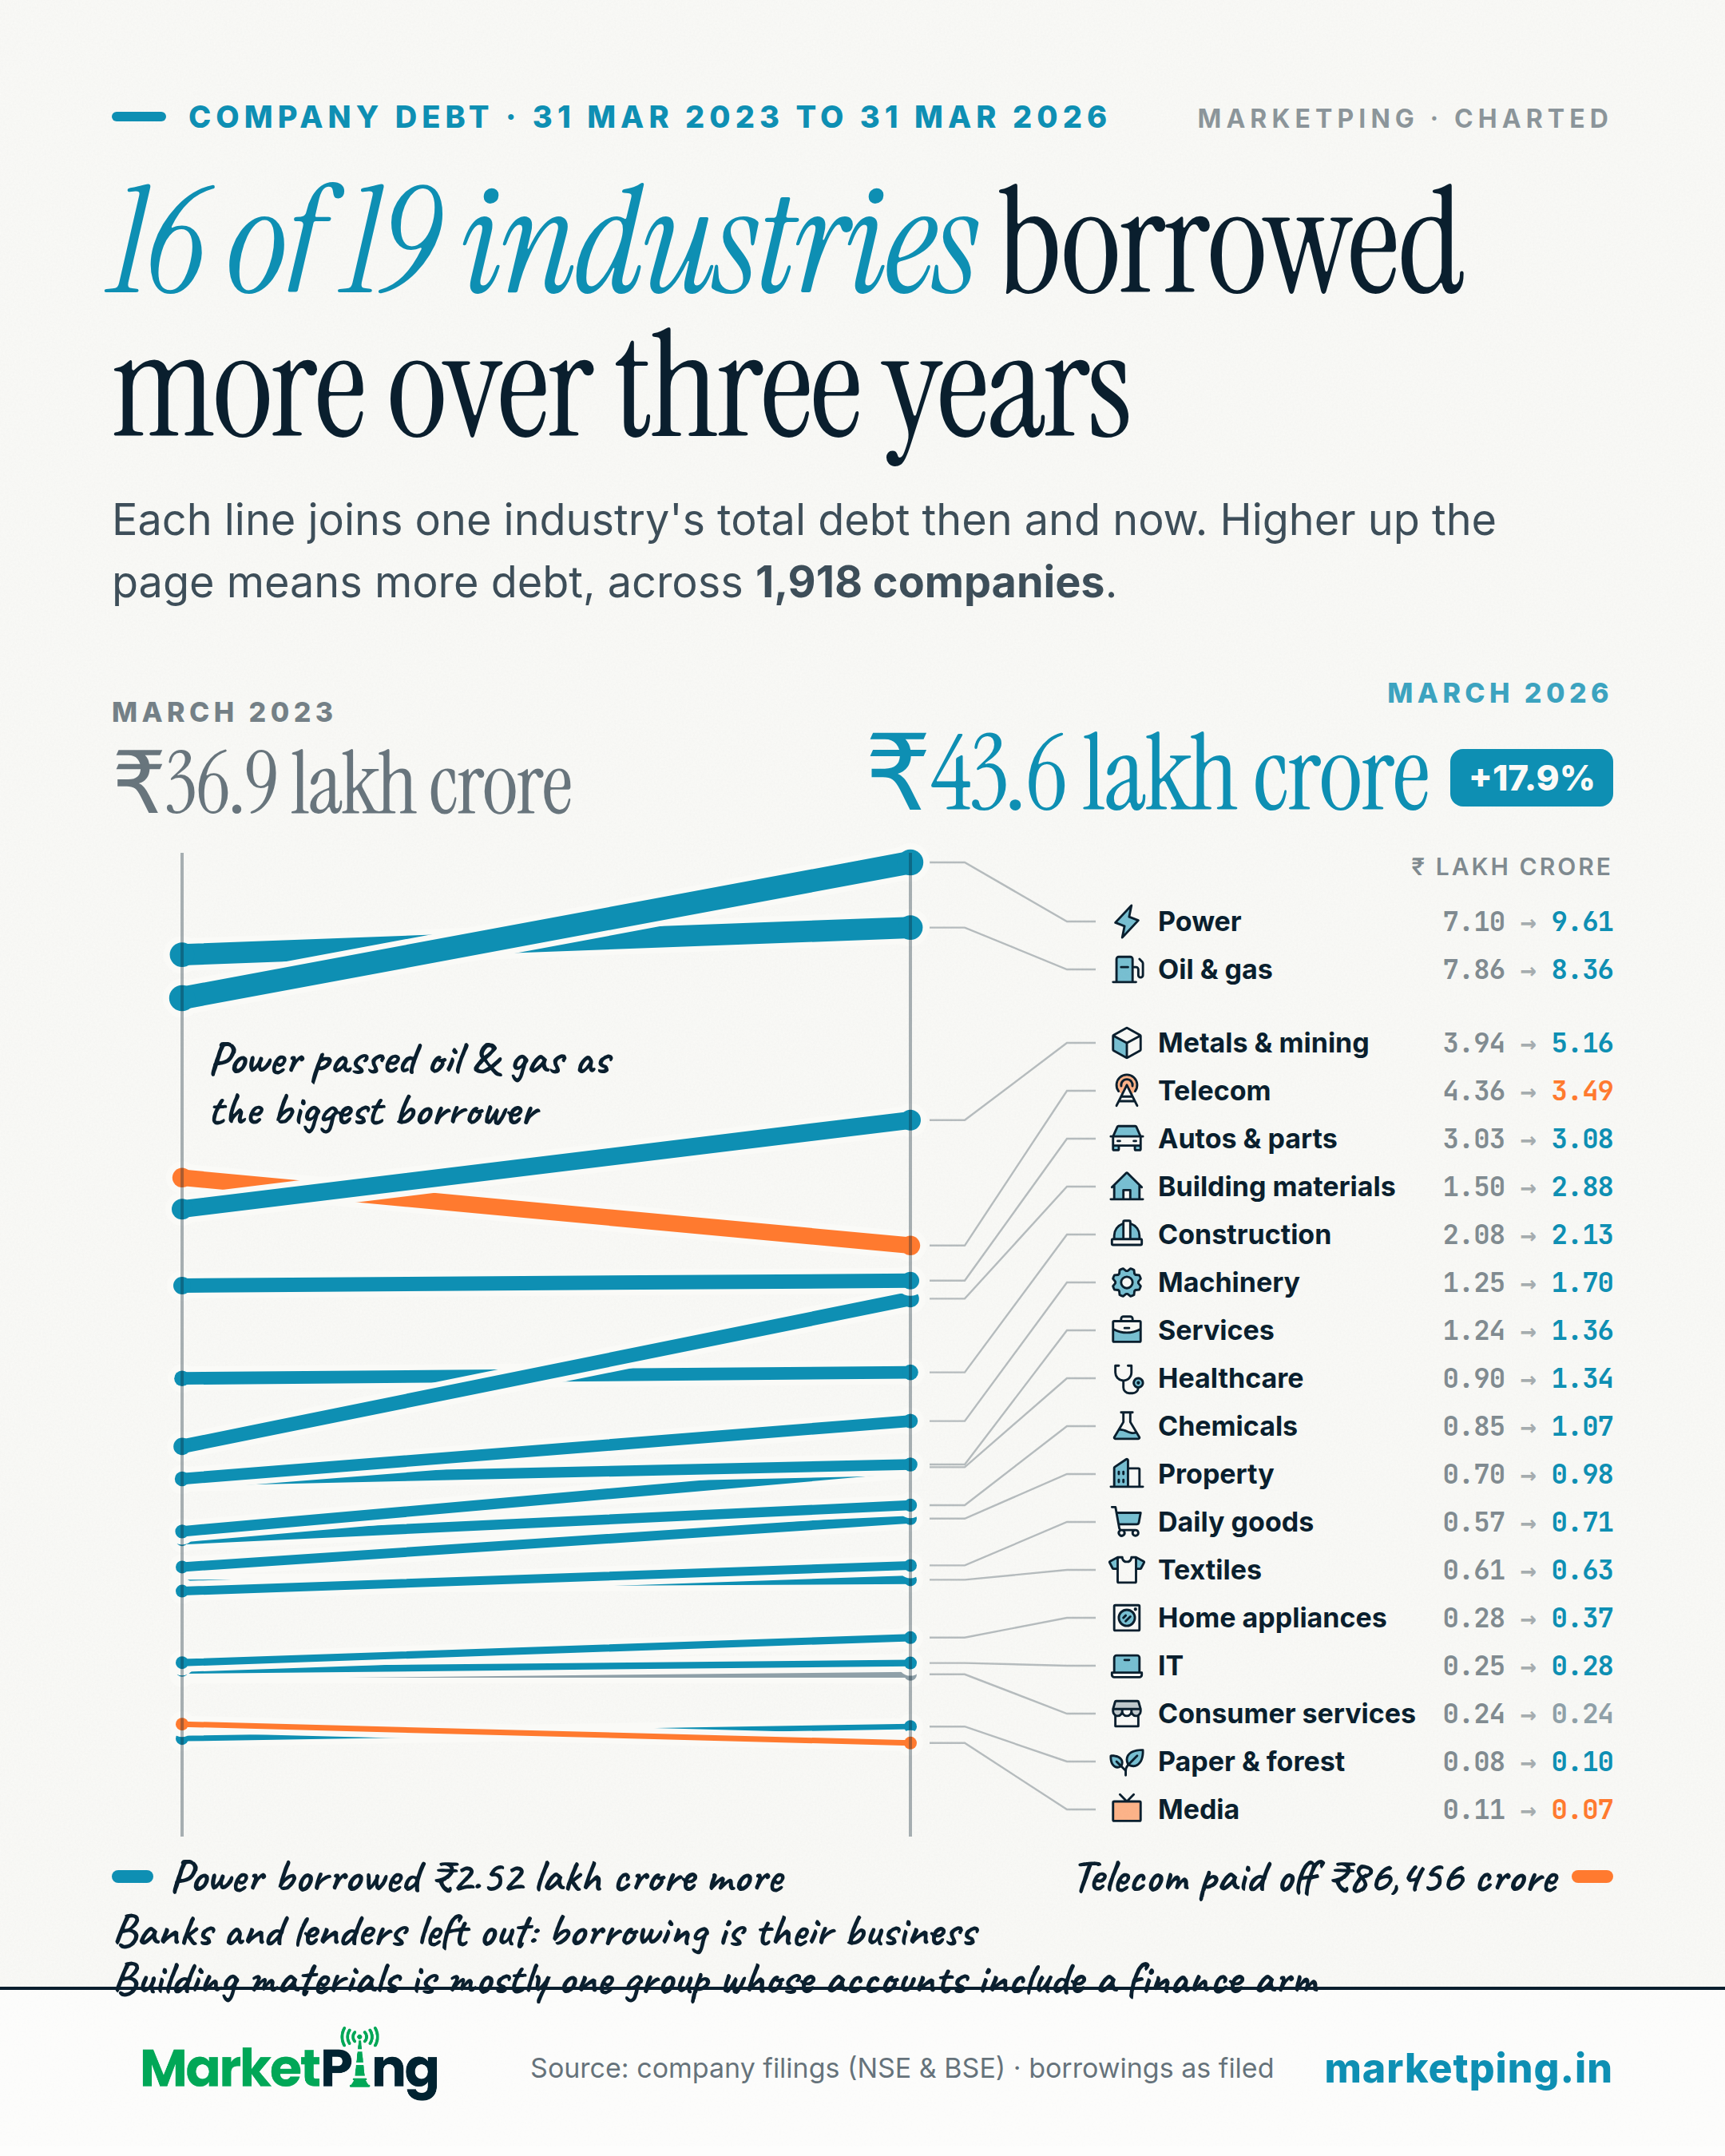
Each line joins one industry's total debt then and now. Higher up the page means more debt, across 1,918 companies.
What the chart shows
Which industries borrowed more over the last three years? Adding up what every listed company owes, 19 industries hold ₹43.6 lakh crore of borrowings, against ₹36.9 lakh crore three years ago. That is +17.9%. Banks, other lenders and insurers are left out: for them, borrowing is the business.
Total borrowings by industry (31 Mar 2023 → 31 Mar 2026)
| Building materials | ₹1.50 lakh crore → ₹2.88 lakh crore (+92.7%, 41 companies) |
|---|---|
| Healthcare | ₹90,240 crore → ₹1.34 lakh crore (+48.1%, 139 companies) |
| Property | ₹69,793 crore → ₹98,230 crore (+40.7%, 90 companies) |
| Machinery | ₹1.25 lakh crore → ₹1.70 lakh crore (+36.0%, 347 companies) |
| Power | ₹7.10 lakh crore → ₹9.61 lakh crore (+35.4%, 27 companies) |
| Home appliances | ₹27,897 crore → ₹37,054 crore (+32.8%, 124 companies) |
| Metals & mining | ₹3.94 lakh crore → ₹5.16 lakh crore (+30.9%, 44 companies) |
| Paper & forest | ₹8,085 crore → ₹10,427 crore (+29.0%, 36 companies) |
| Chemicals | ₹85,351 crore → ₹1.07 lakh crore (+25.3%, 161 companies) |
| Daily goods | ₹57,431 crore → ₹70,655 crore (+23.0%, 176 companies) |
| Services | ₹1.24 lakh crore → ₹1.36 lakh crore (+9.7%, 164 companies) |
| IT | ₹25,358 crore → ₹27,771 crore (+9.5%, 75 companies) |
| Oil & gas | ₹7.86 lakh crore → ₹8.36 lakh crore (+6.3%, 27 companies) |
| Textiles | ₹61,008 crore → ₹63,140 crore (+3.5%, 170 companies) |
| Construction | ₹2.08 lakh crore → ₹2.13 lakh crore (+2.7%, 56 companies) |
| Autos & parts | ₹3.03 lakh crore → ₹3.08 lakh crore (+1.8%, 114 companies) |
| Consumer services | ₹24,086 crore → ₹24,068 crore (-0.1%, 72 companies) |
| Telecom | ₹4.36 lakh crore → ₹3.49 lakh crore (-19.8%, 16 companies) |
| Media | ₹10,920 crore → ₹7,283 crore (-33.3%, 39 companies) |
Power added the most in rupees, ₹2.52 lakh crore. Telecom paid off ₹86,456 crore. 16 of the 19 industries owe more than they did three years ago, 1 owe about the same. Power and oil & gas alone hold 41% of the total.
This is money borrowed, as filed in each company's annual accounts, added up across the industry. It is not a judgement: more debt can mean a new plant, less debt can mean a smaller business. 838 companies that owed under Rs 1 crore three years ago are left out, because a percentage on a base that small means nothing.
How it is measured
Source: company filings (NSE & BSE). Total borrowings, short and long term (current + non-current), from each company's annual accounts for the year to 31 Mar 2026, against the same line three years earlier (31 Mar 2023); figures are as filed, so a group that files accounts for the whole group (consolidated) is counted whole, inside its own industry. Industries are added up in rupees, never averaged as percentages. 3,568 companies had both figures.
Left out: 518 banks, other lenders and insurers (borrowing is their business), 838 whose debt three years ago was under Rs 1 crore, 6 with an impossible figure (either one more than 100 times both the owners' money in the company (equity) and its other debt figure), 270 with no industry tag and 18 in industries with fewer than 15 companies. 1,918 companies in 19 industries are drawn. The height scale is squeezed at the top (a square-root scale) so the smallest industry is readable next to the largest; every rupee figure is printed on the chart. An industry that moved less than 1% either way is drawn grey and called about the same: 1 on this card.
Power and oil & gas together hold 41% of the total.
Using this chart
Free to quote and republish. This chart, with its text, is licensed under Creative Commons Attribution 4.0, including for commercial use and news reporting.
- Reprint the chart, or redraw it in your own style
- Quote its finding and figures
- Use it in print, online, on screen or on air
- Credit MarketPing
- Link to this page where your format allows
- Give the data date: 7 October 2026
The licence covers this page only, not the rest of MarketPing or its data. See our Terms, section 9A.
How to cite
- News storyIn print or online copy
Source: MarketPing, data as of 7 Oct 2026 (marketping.in/charts/debt-slope) - Chart or broadcastUnder the chart, on screen or on air
Source: MarketPing (marketping.in) - Research paperAPA style
MarketPing. (2026, October 6). 16 of 19 industries borrowed more over three years [Chart]. https://marketping.in/charts/debt-slope
Keep the date: this chart is rebuilt every day and may read differently tomorrow.
More on profits, tax and dividends


Facts from public exchange data and company filings. Not investment advice, and not a recommendation about any security. For frozen, citable findings with a full method, see our studies.