
Who pays the most tax? SBI.
Each bar is the tax on one company's profit for the year to March 2026. Top 10 of 5,331 companies.
What the chart shows
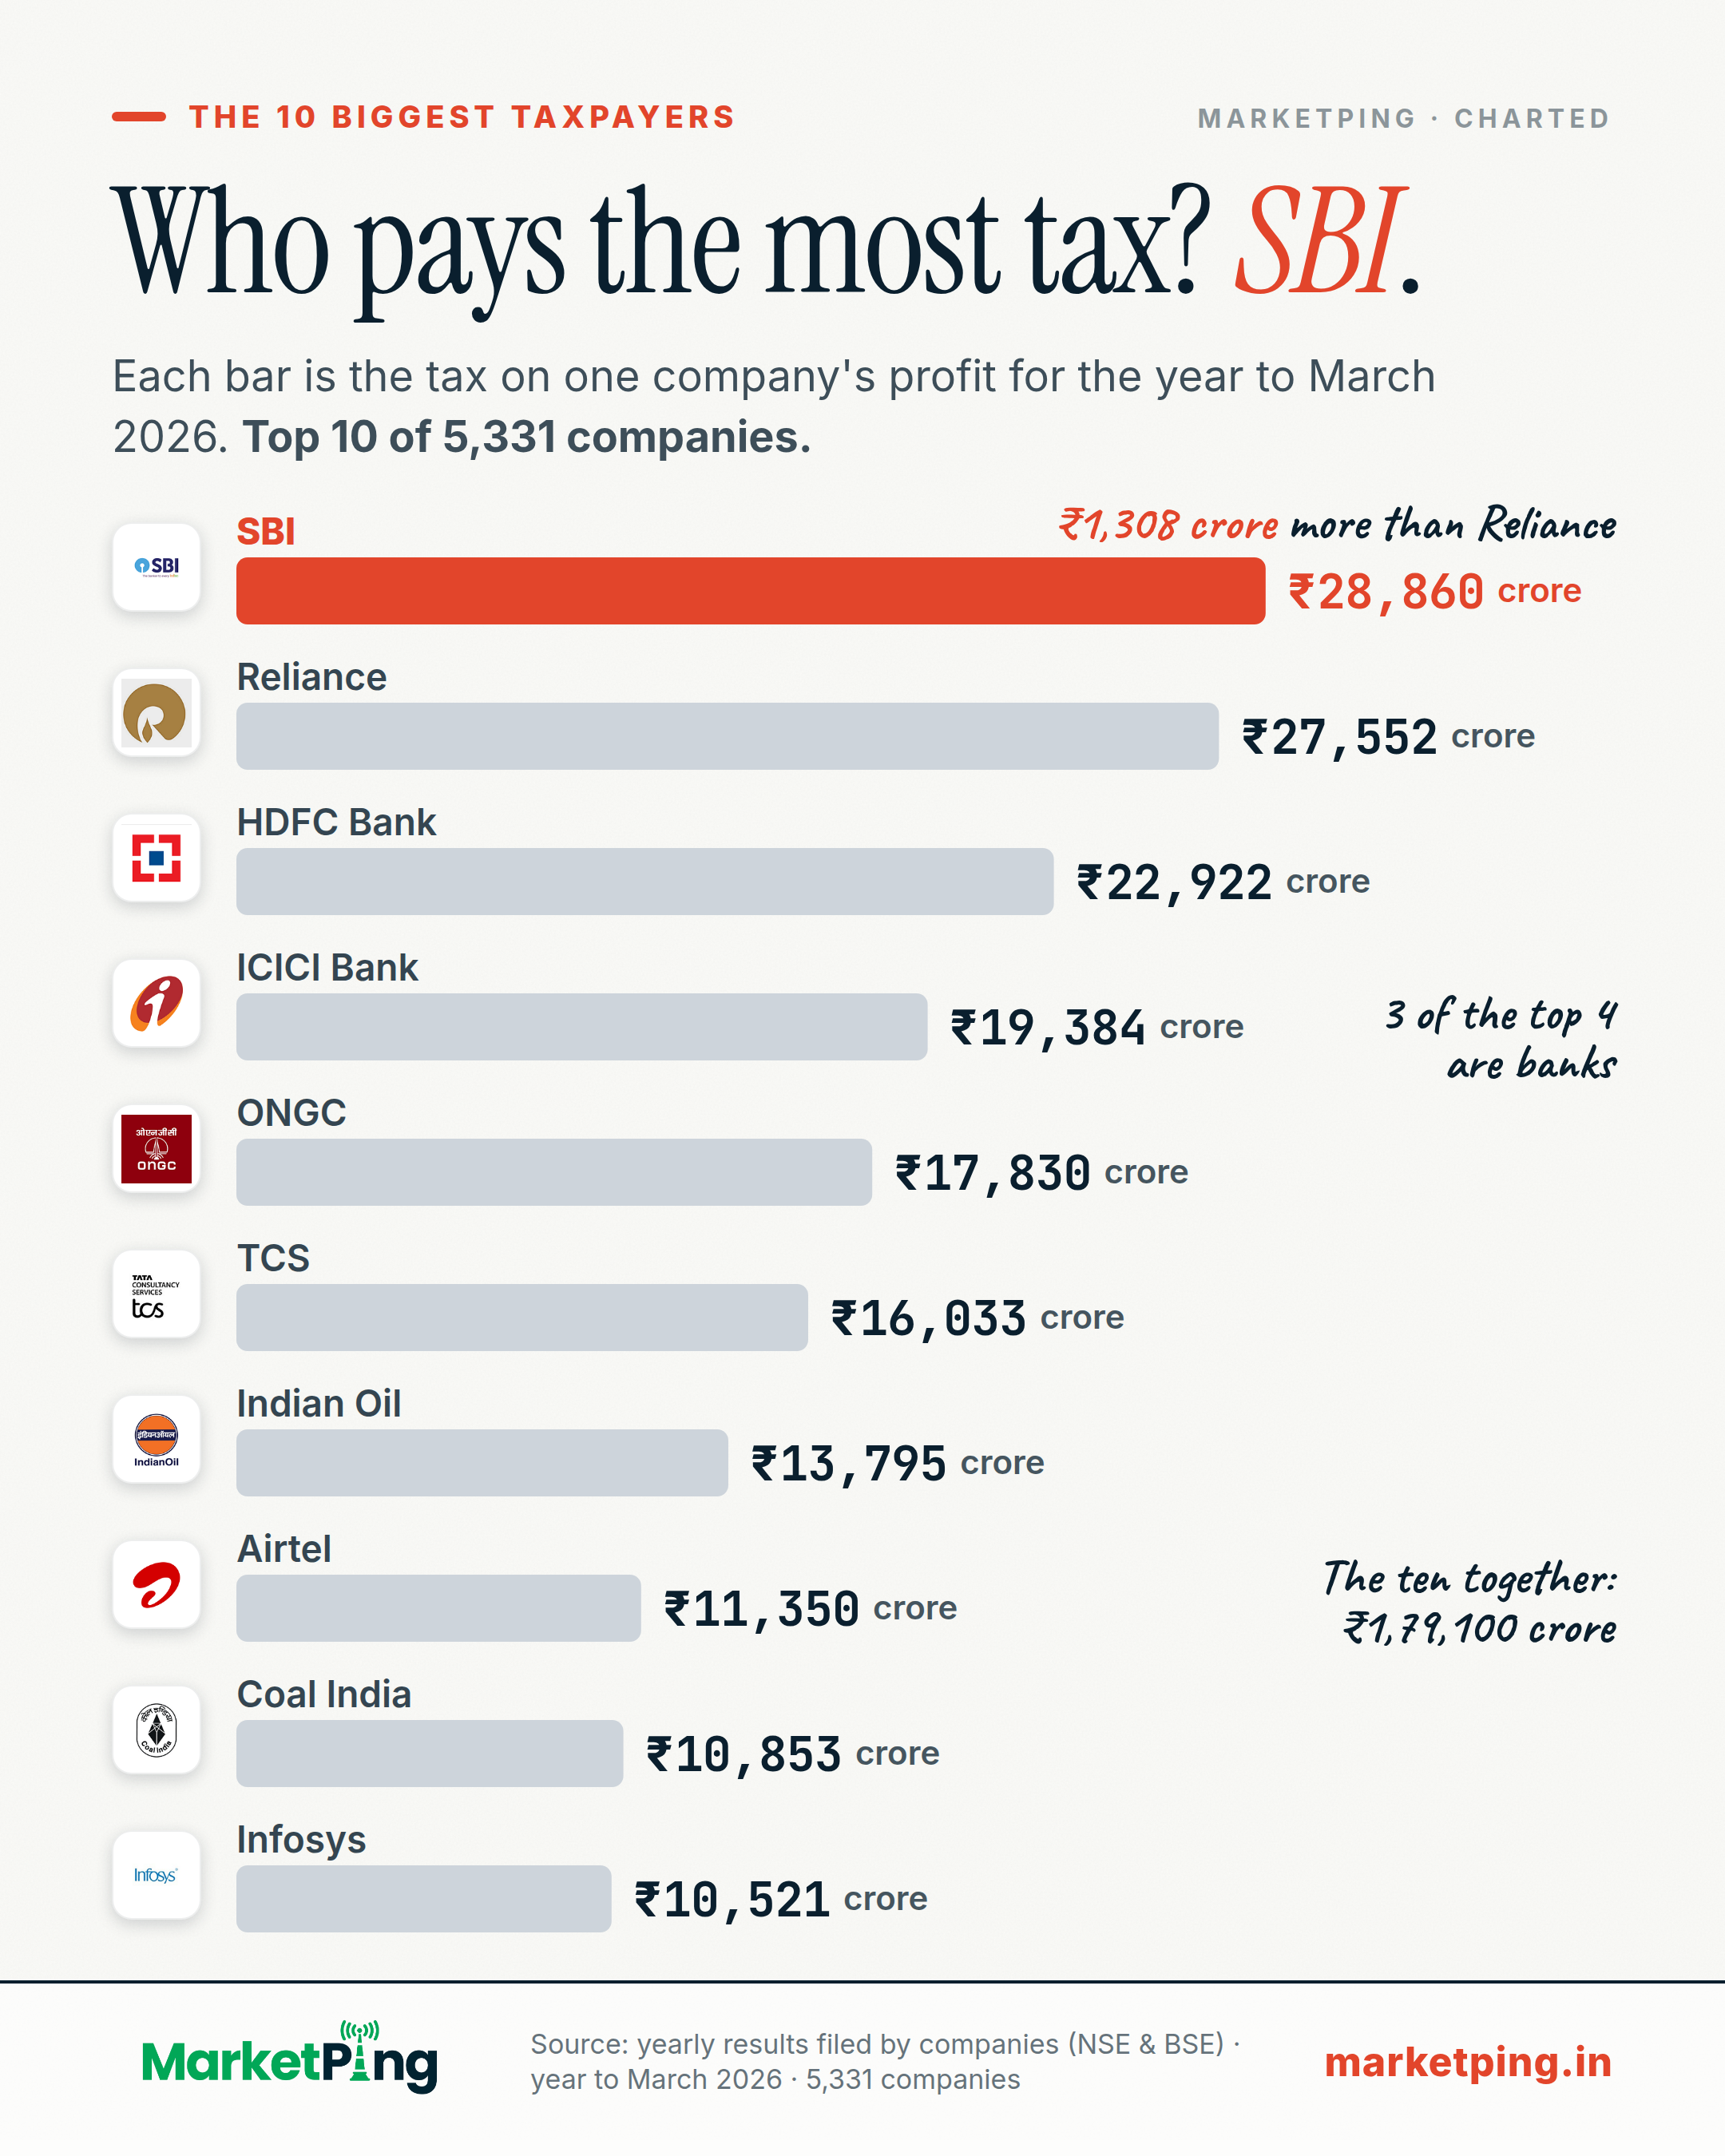
In the year to March 2026, SBI had the biggest tax bill of the 5,331 listed companies whose yearly results we hold: ₹28,860 crore, ₹1,308 crore more than Reliance.
The 10 biggest tax bills (year to March 2026)
| 1. SBI | ₹28,860 crore |
|---|---|
| 2. Reliance | ₹27,552 crore |
| 3. HDFC Bank | ₹22,922 crore |
| 4. ICICI Bank | ₹19,384 crore |
| 5. ONGC | ₹17,830 crore |
| 6. TCS | ₹16,033 crore |
| 7. Indian Oil | ₹13,795 crore |
| 8. Airtel | ₹11,350 crore |
| 9. Coal India | ₹10,853 crore |
| 10. Infosys | ₹10,521 crore |
Next: PNB, ₹9,986 crore. The ten together: ₹1,79,100 crore. 3 of the ten are banks.
What this is: the tax in each company's own yearly accounts, tax for the year plus tax set aside for later years. For a company that owns others, it is the whole group's tax. What it is not: GST or other taxes on sales, or the cash paid to the government in the year. Group figures include listed companies they own, so the bills of all listed companies cannot simply be added up.
How it is measured
A tax bill here is the tax charged in a company's own yearly accounts (its profit and loss statement) for the year to March 2026: tax for the year plus tax set aside for later years (current and deferred tax). It is tax on profit only. GST and other taxes on sales are not in it, and it is not the cash paid to the government in the year.
For a company that owns others, the figure is the whole group's (consolidated), which includes the companies it owns more than half of; a company without group accounts is counted on its own (standalone). Where a year has more than one version on file, the latest is used. 5,331 listed companies filed full-year results for the year. As a check against reading errors, a company is ranked only when its tax is between 10% and 45% of its profit before tax; 3,484 are ranked and 1,847 are set aside (1,011 with a loss or no profit, 571 with tax under 10%, 234 with tax over 45%, 31 with no tax or profit figure).
None of those set aside has a tax bill, or a bound on one from the figures we hold, as big as the 10th bill here (3 companies have no figures at all for the year and cannot be checked). The ten bills can be added up: none of the ten owns more than half of another. A total for every listed company is not given, because group figures include listed companies they own and a total would count those bills twice.
A tax bill says how much tax a company's accounts charged for the year. It says nothing about whether the company is good, cheap or well run.
Using this chart
Free to quote and republish. This chart, with its text, is licensed under Creative Commons Attribution 4.0, including for commercial use and news reporting.
- Reprint the chart, or redraw it in your own style
- Quote its finding and figures
- Use it in print, online, on screen or on air
- Credit MarketPing
- Link to this page where your format allows
- Give the data date: 8 October 2026
The licence covers this page only, not the rest of MarketPing or its data. See our Terms, section 9A.
How to cite
- News storyIn print or online copy
Source: MarketPing, data as of 8 Oct 2026 (marketping.in/charts/tax-bill) - Chart or broadcastUnder the chart, on screen or on air
Source: MarketPing (marketping.in) - Research paperAPA style
MarketPing. (2026, October 7). Who pays the most tax? SBI. [Chart]. https://marketping.in/charts/tax-bill
Keep the date: this chart is rebuilt every day and may read differently tomorrow.
More on profits, tax and dividends


Facts from public exchange data and company filings. Not investment advice, and not a recommendation about any security. For frozen, citable findings with a full method, see our studies.