
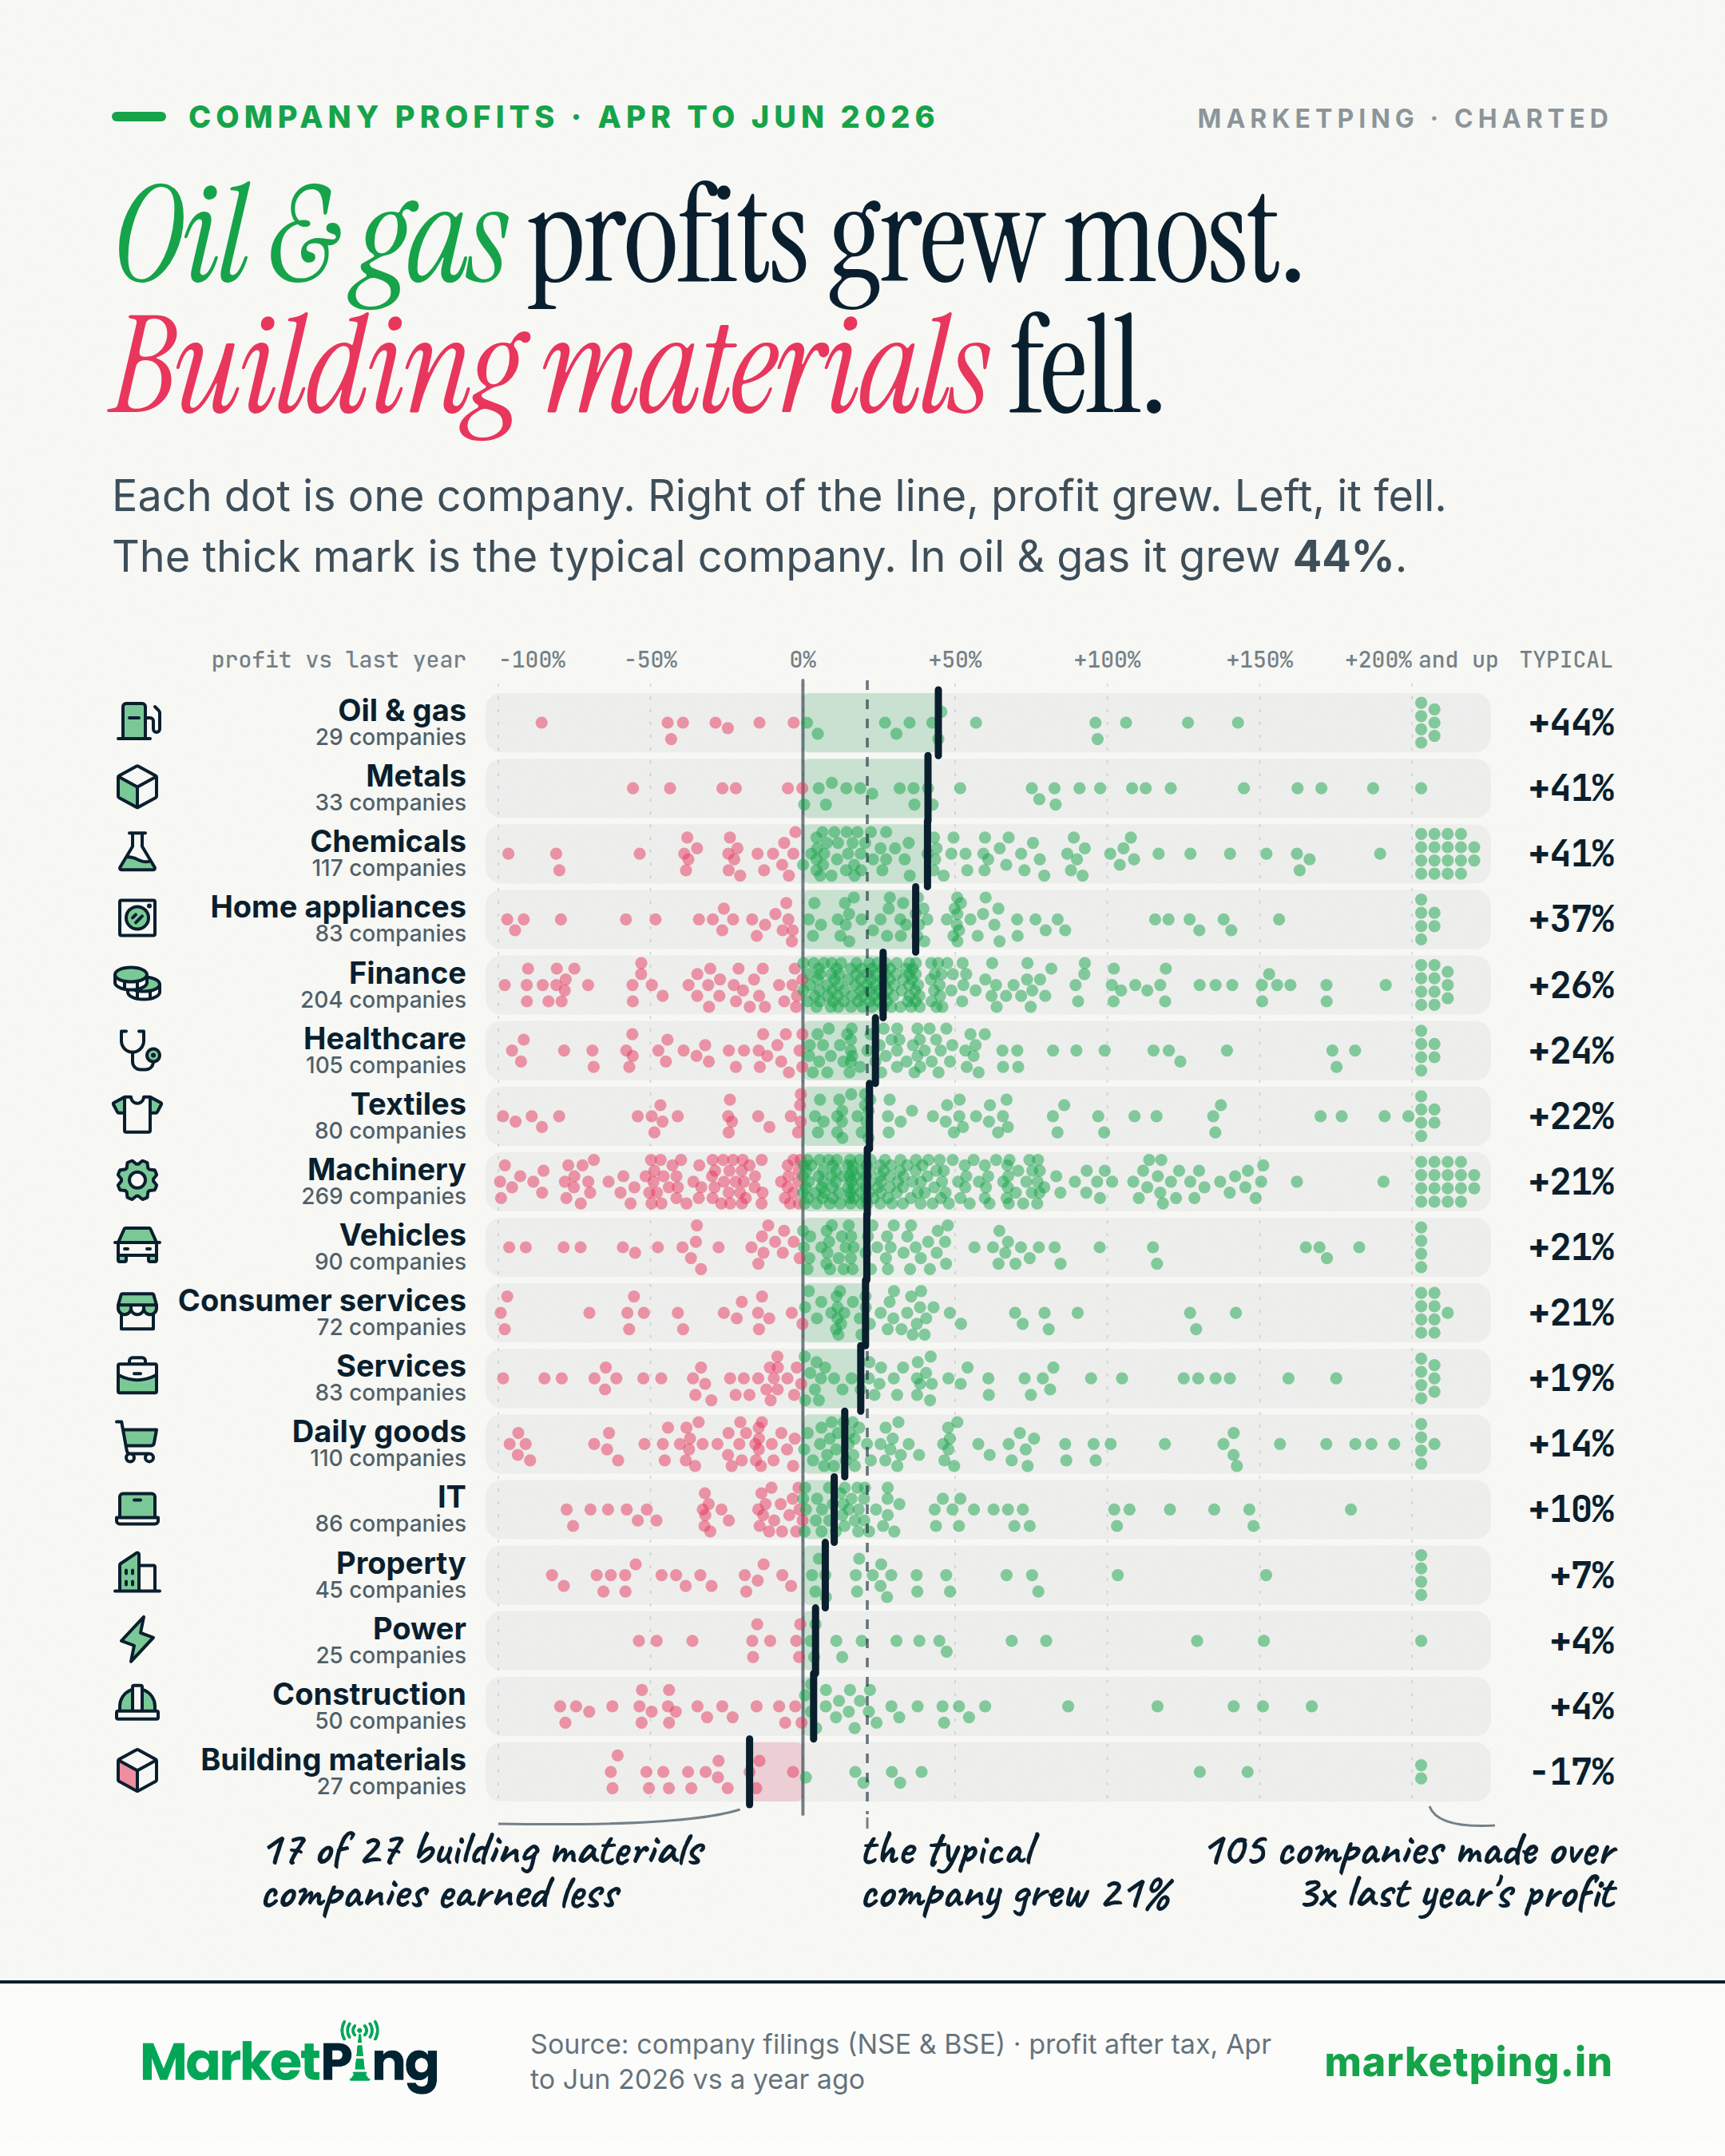
Oil & gas profits grew most. Building materials fell.
Each dot is one company. Right of the line, profit grew. Left, it fell. The thick mark is the typical company. In oil & gas it grew 44%.
What the chart shows
Which industries grew profit most in Apr to Jun 2026? Here is the typical company in each, compared with the same months last year. It covers 1,508 listed companies that made a profit both times.
Profit growth of the typical company, vs last year
| Oil & gas | +44.5% (29 companies) |
|---|---|
| Metals | +41.1% (33 companies) |
| Chemicals | +40.9% (117 companies) |
| Home appliances | +37.0% (83 companies) |
| Finance | +26.4% (204 companies) |
| Healthcare | +23.8% (105 companies) |
| Textiles | +21.9% (80 companies) |
| Machinery | +21.2% (269 companies) |
| Vehicles | +21.0% (90 companies) |
| Consumer services | +20.6% (72 companies) |
| Services | +19.0% (83 companies) |
| Daily goods | +13.7% (110 companies) |
| IT | +10.3% (86 companies) |
| Property | +7.4% (45 companies) |
| Power | +4.1% (25 companies) |
| Construction | +3.5% (50 companies) |
| Building materials | -17.5% (27 companies) |
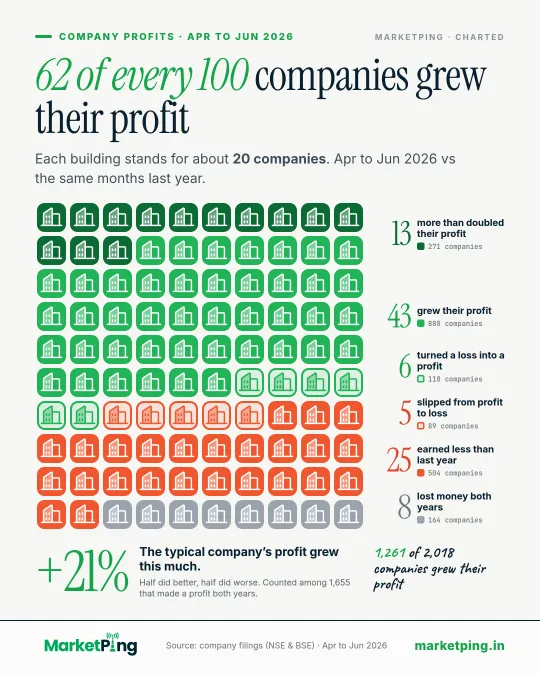
Across all 1,655 companies with a profit in both quarters, the typical company's profit changed by +21.2%. 110 more turned a loss into a profit, 89 slipped from profit to loss and 164 lost money in both; a percentage means nothing for those, so they are counted, not plotted.
This counts companies, not market value: a small company weighs the same as a large one. 628 companies with a year-ago profit or loss under Rs 1 crore are left out.
How it is measured
Source: company filings (NSE & BSE). Profit after tax (net profit), quarter ended 30 Jun 2026 vs a year ago: 1,508 companies with a profit both times, in 17 sectors that have 25 or more such companies. The typical company is the middle one in each sector (the median).
Not plotted: 110 loss to profit, 89 profit to loss, 164 loss in both, 147 in other sectors.
Using this chart
Free to quote and republish. This chart, with its text, is licensed under Creative Commons Attribution 4.0, including for commercial use and news reporting.
- Reprint the chart, or redraw it in your own style
- Quote its finding and figures
- Use it in print, online, on screen or on air
- Credit MarketPing
- Link to this page where your format allows
- Give the data date: 7 October 2026
The licence covers this page only, not the rest of MarketPing or its data. See our Terms, section 9A.
How to cite
- News storyIn print or online copy
Source: MarketPing, data as of 7 Oct 2026 (marketping.in/charts/sector-profit) - Chart or broadcastUnder the chart, on screen or on air
Source: MarketPing (marketping.in) - Research paperAPA style
MarketPing. (2026, October 6). Oil & gas profits grew most. Building materials fell. [Chart]. https://marketping.in/charts/sector-profit
Keep the date: this chart is rebuilt every day and may read differently tomorrow.
More on profits, tax and dividends


Facts from public exchange data and company filings. Not investment advice, and not a recommendation about any security. For frozen, citable findings with a full method, see our studies.